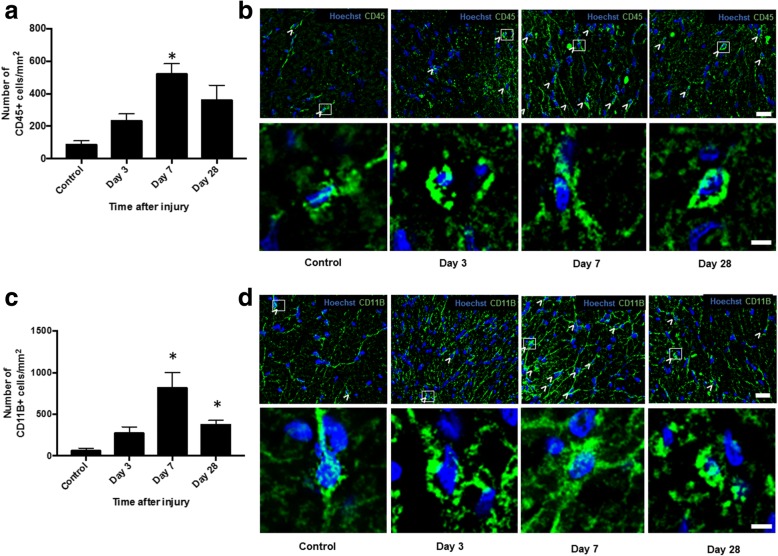
Fig. 4.
Quantification of CD11B+ and CD45+ cells in ventral ON vulnerable to secondary degeneration. Mean ± SEM numbers of a CD45+ and c CD11b+ cells in control, uninjured optic nerve and at 3, 7, and 28 days following partial optic nerve transection, in ventral optic nerve vulnerable to secondary degeneration are shown. * indicates significantly different from normal (p ≤ 0.05), n = 6/group. Representative low- and high-magnification images of b CD45 and d CD11b in the ventral aspect of the optic nerve are shown in control uninjured, 3, 7, and 28 days after injury. Examples of CD45+ and CD11b+ cells, boxed cells at low magnification, are shown in high magnification. Scale bar of b and d: 20 μm top images and 3 μm bottom images for each

