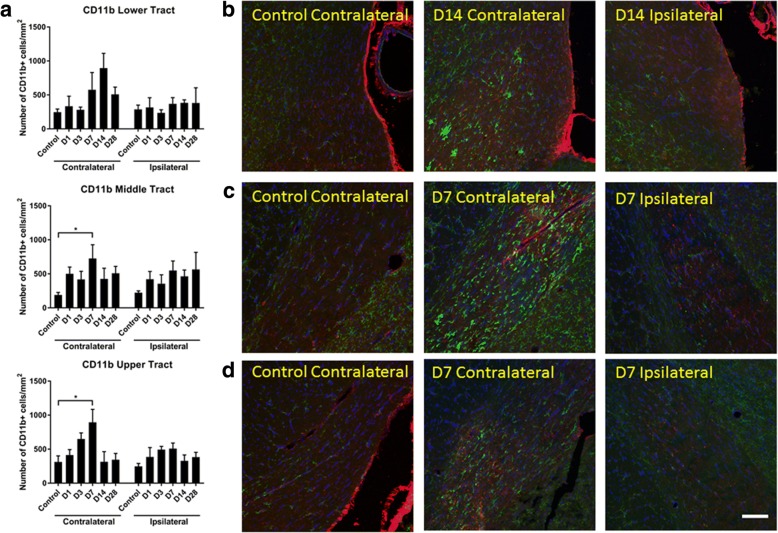
Fig. 5.
Quantification of CD11b+ cells in the optic tract of the brain. Mean ± SEM numbers of a CD11b+ cells in the lower, middle, and upper regions of the optic tract in control uninjured optic nerve, compared to 1, 3, 7, 14, and 28 days following partial optic nerve transection, assessed separately for the right and left hand sides of the brain, n = 5–6/group. *p ≤ 0.05, **p ≤ 0.01, ***p ≤ 0.001, ****p ≤ 0.0001. Representative images of infiltrating CD11b+ cells in the b lower, c middle, and d upper optic tract, in control uninjured, and 7–14 days following partial optic nerve transection: D is day. Scale bar of b–d: 100 μm

