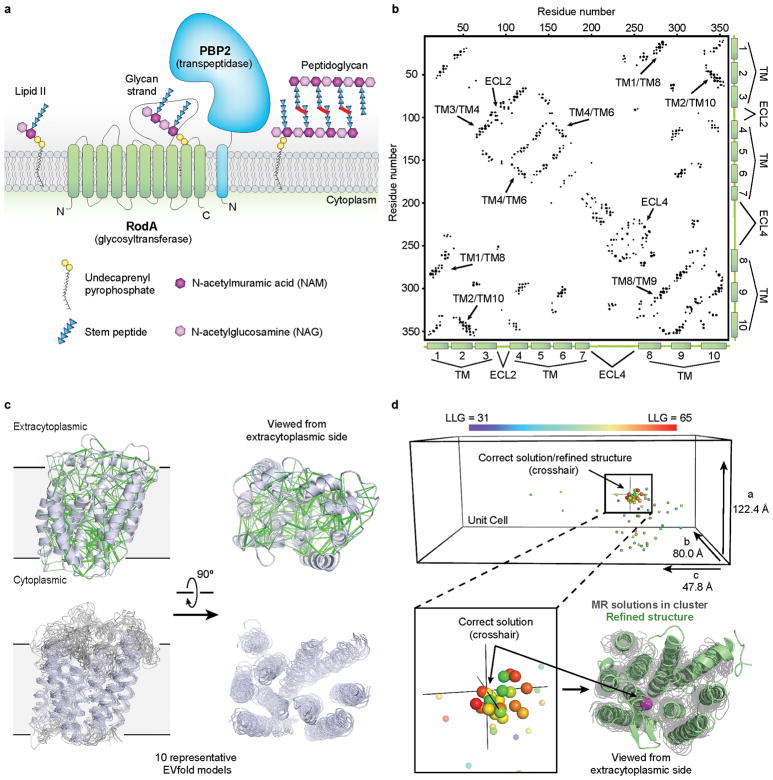
Figure 1. Biological role of RodA and evolutionary covariation fold prediction.
a, RodA is a peptidoglycan polymerase. b, Evolutionary covariation map showing 476 co-evolved residues in RodA. c, Evolutionary couplings (green lines) were used to generate models of RodA. Ten representative models are shown. d, Molecular replacement (MR) solutions obtained from 100 RodA models. As a reference point, the Cα atom of Glu108 is shown as a sphere colored according to LLG score for each solution. The corresponding position for the final refined RodA structure is shown as a crosshair. The refined structure (green) and the Cα atom of Glu108 (magenta sphere) is overlaid with the top MR solutions shown in gray.

