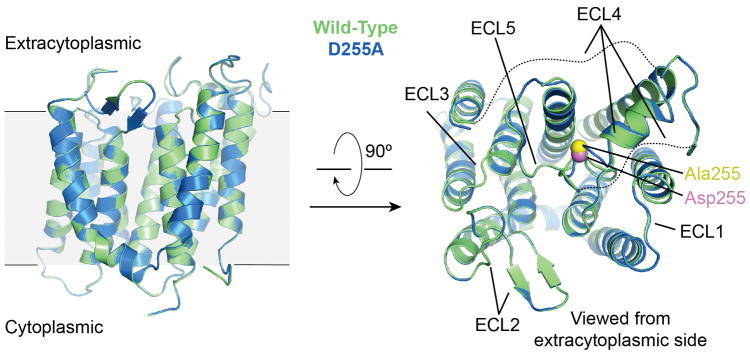
Extended Data Figure 2. Comparison of RodA wild-type and D255A structures.
Structures of wild-type (green) and D255A (blue) RodA are shown viewed parallel to the membrane and from the extracytoplasmic side in the left and right panels, respectively. The Cα atom of residue 255 for each structure is shown in spheres and colored pink and yellow for wild-type and D255A, respectively. The dashed lines represent the disordered residues 189 – 227 and 237 – 251 in both structures. The two structures are essentially identical with a Cα RMSD of 0.1 Å.

