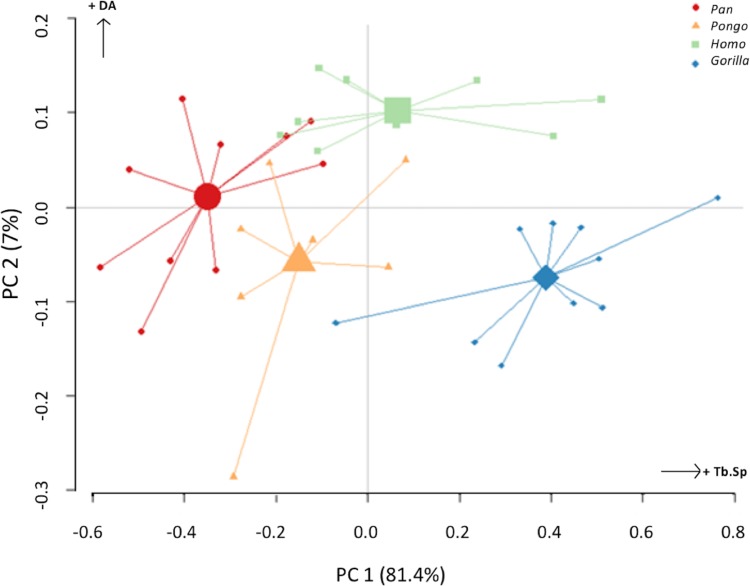
Figure 10. Results of principal components analysis of three trabecular variables (Tb.N, Tb.Sp. and DA) in all analysed regions.
PC1 is mainly driven by variation in trabecular separation, while PC2 is driven primarily by degree of anisotropy (also see Table S2 for loadings).

