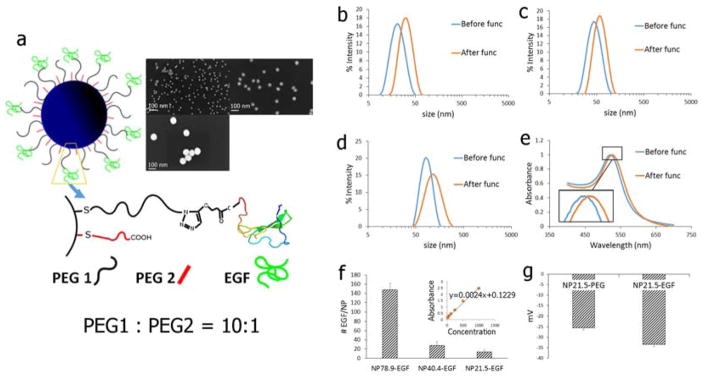
Figure 1.
a) Schematic drawing of the NP-EGF used in this work. PEG1 = HS–(CH2)11–(C2H4O)6–COOH; PEG2 = HS–CH2CH2–(C2H4O)77–N3. The inset shows SEM images of the different NP cores used. The average NP size (± standard deviation) of the NP is (clockwise): 21.5 ± 0.9 nm; 40.4 ± 1.0 nm; 78.9 ± 1.3 nm. b)–d) Hydrodynamic diameter (intensity statistics) as determined by DLS of citrate capped b) NP21.5, c) NP40.4, and d) NP78.9. e) UV-Vis for NP40.4 before and after functionalization with EGF. f) Number of EGF bound per NP for (left to right): NP78.9-EGF, NP40.4-EGF, NP21.5-EGF. Inset shows ELISA calibration standard obtained with free EGF. g) Zeta-Potentials of NP21.5 before (NP21.5-PEG) and after (NP21.5-EGF) functionalization with EGF.

