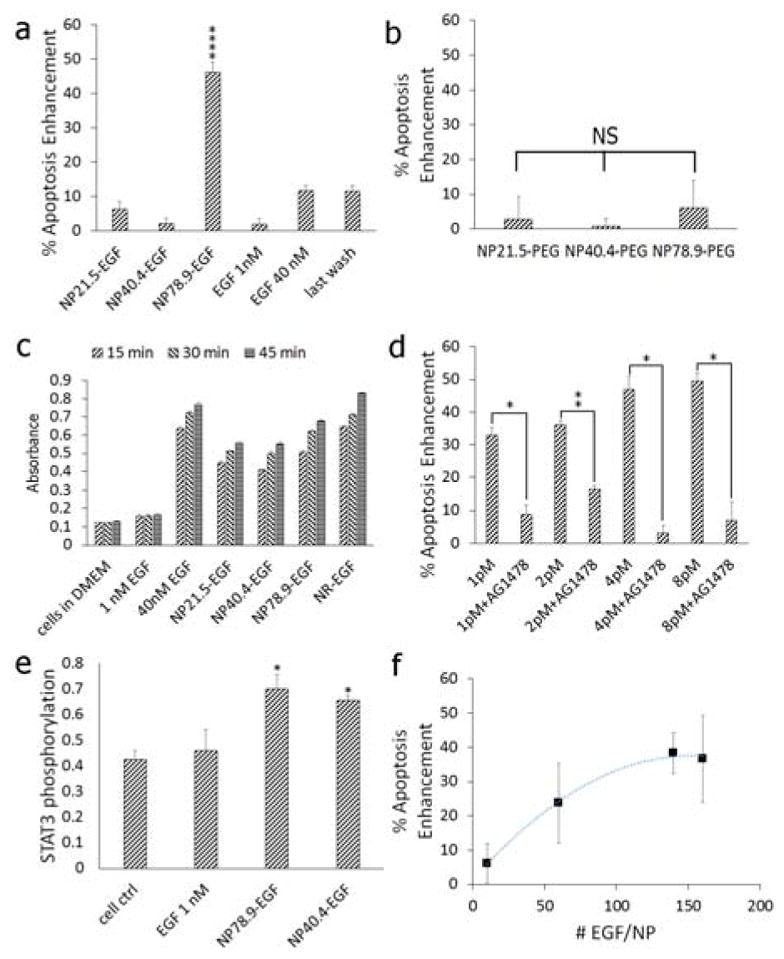
Figure 2.

a) Caspase-3 activity (relative to the no treatment control) measured after 4h of exposure to (from left to right) NP21.5-EGF, NP40.4-EGF, NP78.9-EGF, NP98.1-EGF,1 nM free EGF, 40 nM free EGF, and the supernatant of the last wash of NP98.1-EGF. The effective EGF concentration for the different NP-EGF concentrations was 1.0 nM (see text). The plotted data were collected in at least six independent experiments. Error bars show standard errors of the mean. Only NP78.9-EGF show a significant increase at a significance level of ****p < 0.0001. b) Caspase-3 activity (relative to the no treatment control) for pegylated NPs (no EGF) as function of NP core size. NS = not significant. c) ELISA absorbance signal of phosphorylated EGFR after 15, 30, and 45 min of incubation with (from left to right): no treatment control, 1 nM free EGF, 40 nM free EGF, NP21.5-EGF, NP40.4-EGF, NP78.9-EGF, NR-EGF (AR = 8.6). d) Apoptosis enhancement as function of NP78.9-EGF concentration in the absence and presence of the RTK inhibitor AG1478 (250 nM). The effective EGF concentrations are 0.15 nM, 0.30 nM, 0.60 nM, 1.20 nM. *p < 0.05, **p < 0.01. e) STAT3 phosphorylation for no treatment control, 1 nM free EGF, and NP78.9-EGF and NP40.4-EGF with an effective EGF concentration of 1 nM (*p < 0.05 relative to the cell control). f) Apoptosis enhancement as function of number of EGF peptides bound to NP78.9-EGF. Data in (b) and (f) were collected in three independent experiments; data in (c) – (e) were collected from two independent experiments. Error bars show standard deviations.
