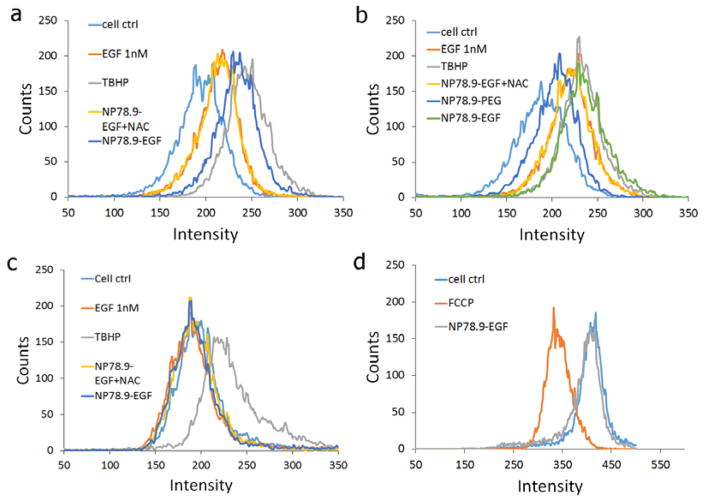
Figure 5.
a) Quantification of ROS levels through fluorescence flow cytometry using a CellRox assay. Fluorescence histogram for no treatment control, TBHP positive control, NP78.9-EGF + NAC (NAC), and NP78.9-EGF are included. b) Same data as in (a) but after additional culturing for 20h after removal of NP78.9-EGF. NP78.9-PEG was included as additional control. c) Quantification of mitochondrial ROS under the same conditions as in (a). d) JC1 mitochondrial membrane potential assay. NP78.9-EGF does not result in a measurable reduction in fluorescence intensity relative to the no treatment control, indicating intact mitochondria membranes. FCCP = carbonyl cyanide 4-(trifluoromethoxy) phenylhydrazone is a positive control that reduces the mitochondria potential.

