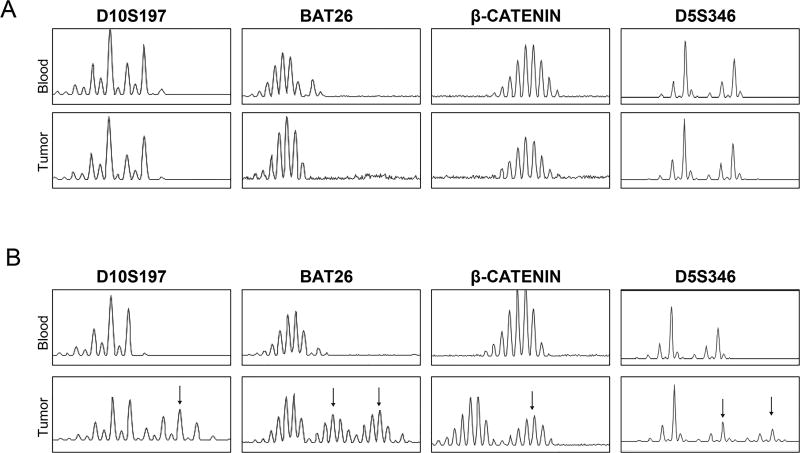
Figure 3.
Detection of MSI by fragment analysis of microsatellite markers in xenografts and in corresponding human blood normal. The figure shows four representative microsatellites: D10S197, BAT26, β-Catenin and D5S346. Arrows highlight those microsatellite markers that display instability. A. Tumor with MSS pattern. B. Tumor with MSI-H pattern.

