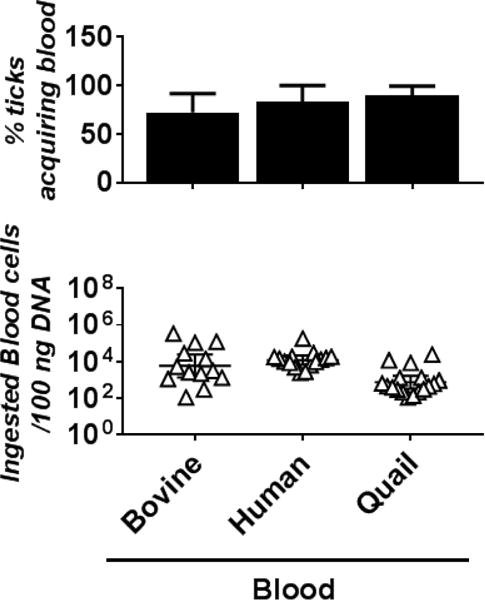
Figure 2. I. scapularis nymphal ticks are capable of acquiring bovine, human, and quail blood.

Naïve and flat I. scapularis nymphal ticks were placed into the artificial feeding chamber in six-well cell culture plates with the indicated bovine, human, or quail blood (six to eight nymphs per chamber [see Table 1]). After being placed in the chambers for 5 days, the nymphs were collected to determine whether they had acquired blood from these animals using qPCR (see Material and Methods). (Top panel) The percentage of blood-acquired nymphs was calculated using the number of nymphs determined positive with blood (see Material and Methods) divided by total number of the nymphs in each membrane chamber. Bars represent the mean of three independent membrane chambers ± standard deviation. The values of these determinations are also shown in Table 1. The data were subjected to a D’Agostino-Pearson Omnibus normality test to examine for the normal distribution. As all values were not in a normal distribution, statistical significance was determined using a non-parametric Kruskal-Wallis test followed by Dunn’s multiple comparisons test. There is no significant difference between the percent of nymphs fed among the different blood types. The p-values between each group are shown in Supplemental Table 3. (Bottom panel) The number of blood cells in these blood-fed nymphs were also determined (see Material and Methods). Each triangle indicates the number of blood cells ingested by a single nymph. Shown are the geometric means of the numbers of ingested blood cells in nymphs per 100 ng of DNA ± 95% confidence interval of 13 nymphs per group. As all values were not in a normal distribution using a D’Agostino-Pearson Omnibus normality test, statistical significance was determined using a non-parametric Kruskal-Wallis test followed by Dunn’s multiple comparisons test. No statistically significant difference in the number of blood cells was observed. The p-values between each group are shown in Supplemental Table 3.
