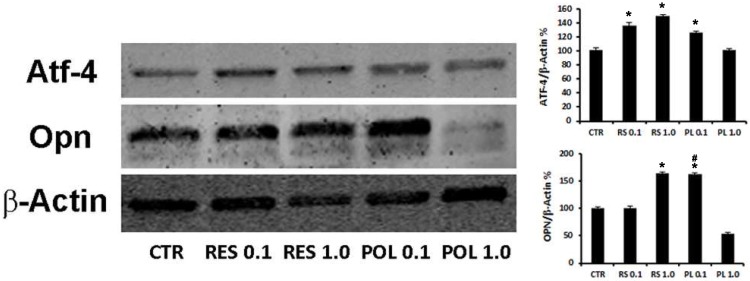
Fig 2.
Effect of Res and Pol on the expression of osteogenic markers ATF-4 and OPN. Immunoblots show the protein expression profile of two markers of osteogenic differentiation, ATF-4 and OPN, in DBSCs stimulated with a pulse (72h) of Res and Pol (Res 0.1-1.0 μM and Pol 0.1-1.0 μM) during 7 days in osteogenic conditions and CTR. Each graph represents the mean OD ± SE of 3 independent experiments performed in triplicate. ∗P < 0.01 compared to T0. #P < 0.01 compared to Res 0.1 μM. Student's t-test was used for single comparison. Representative immunoblotting were chosen for the figure.

