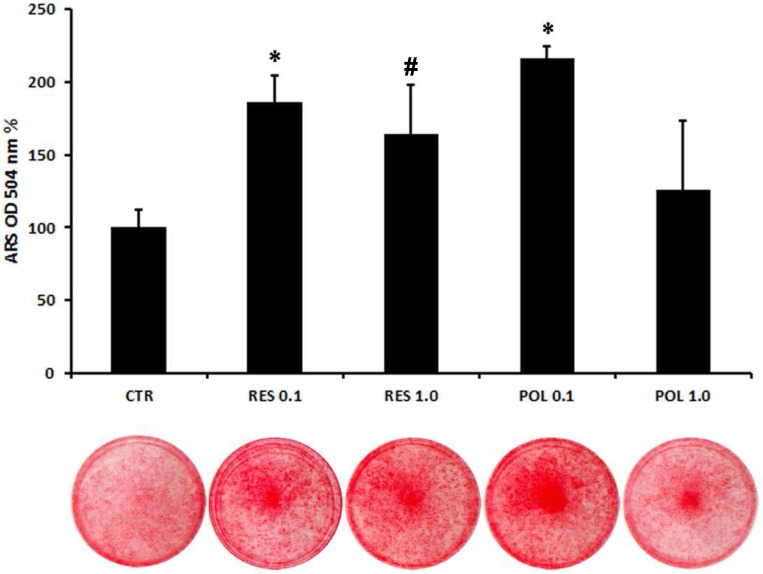
Fig 4.
Quantification of mineral matrix deposition following Res and Pol stimulation. Mineral matrix deposition was assayed after 21 days in osteogenic conditions by ARS (red staining). The graph shows the OD quantification of extracted dye from stained cell layers as mean percentage ± SE of 3 independent experiments performed in quadruplicate. *P<0,001; #P< 0.05 compared to CTR. Student's t-test was used for single comparisons. The wells of a representative experiment were chosen for the figure.

