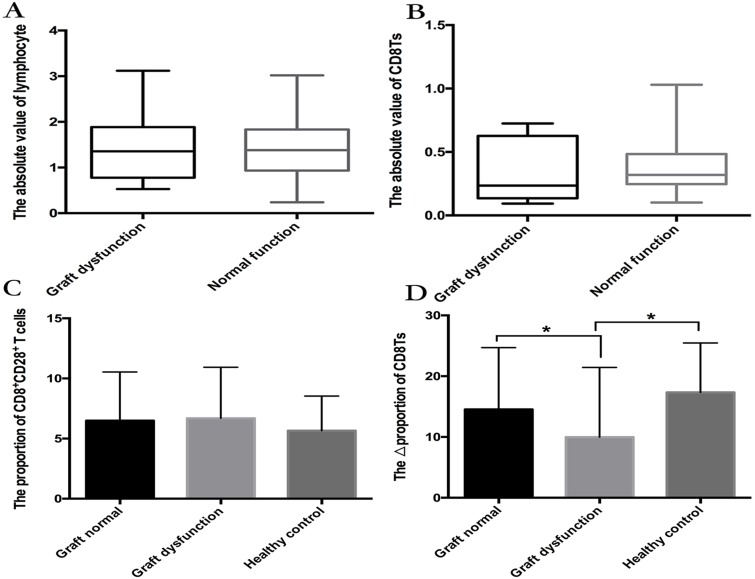
Figure 3.
(A, B) The number of lymphocytes (A) and absolute value of CD8Ts (B) in graft-dysfunction and normal graft function groups. There were no significant differences between groups. (C, D) Median proportion of CD8+CD28+ T cells (C) and ΔCD8T proportion (D) in the normal function group and graft-dysfunction group.

