Figure 4.
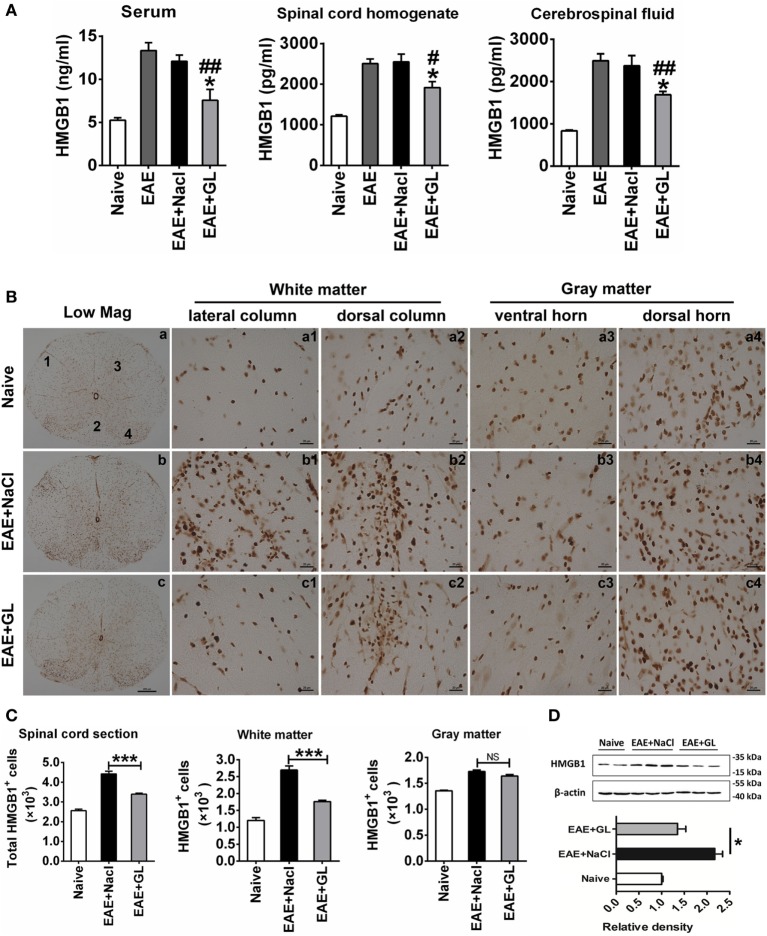
The expression and release of high-mobility group box 1 (HMGB1) inhibited by glycyrrhizin (GL) treatment. (A) HMGB1 levels in different body fluids. “Naive,” “experimental autoimmune encephalomyelitis (EAE) + NaCl” and “EAE + GL” mean control group, EAE induction with NaCl treatment group, and EAE induction with GL treatment group, respectively. Data are shown as the mean ± SEM, n = 5–8 for serum and cerebrospinal fluid and n = 6 for spinal cord homogenate in each experimental group. *P < 0.05 vs EAE + NaCl group, #P < 0.05, ##P < 0.01 vs EAE group, using one-way ANOVA followed by Bonferroni’s test. (B) Expression of HMGB1 in thoracic spinal cord sections in naive mice and EAE mice after day 25 treated with either NaCl or GL. 1: lateral column; 2: dorsal column; 3: ventral horn; 4: dorsal horn. Scale bars were 200 µm for low magnification and 20 µm for high magnification. (C) The number of HGMB1-positive cells in one spinal cord section. At least six serial thoracic spinal cord sections were analyzed from each mouse, and six mice were included in each group. Data are expressed as the mean ± SEM. ***P < 0.001 vs EAE + NaCl group; NS, not significant, using one-way ANOVA followed by Bonferroni’s test. (D) Relative densitometry analysis of HMGB1 (25 kDa) normalized to β-actin (43 kDa). Data are shown as the mean ± SEM, n = 4 animals in each experimental group. *P < 0.05 vs EAE + NaCl group, using one-way ANOVA followed by Bonferroni’s test. These data were representative of three independent experiments.

