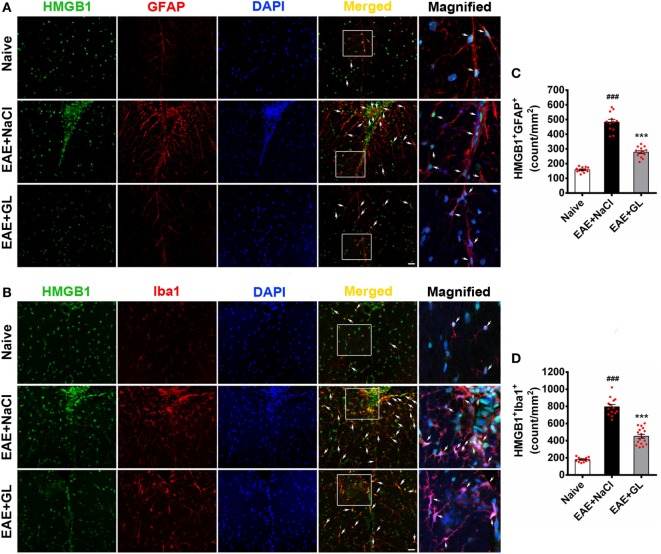
Figure 5.
The number of high-mobility group box 1 (HMGB1)-expressing astrocytes and microglia in the thoracic spinal cord of experimental autoimmune encephalomyelitis (EAE) mice treated with glycyrrhizin (GL). HMGB1 was labeled with green fluorescence [glial fibrillary acidic protein (GFAP)] and Iba1 was labeled with red color, respectively. Nuclei were stained with DAPI in blue. (A) The expression of HMGB1 and GFAP in the white matter (WM) following confocal microscopy is indicated by white arrows. White boxes in the merged images are magnified regions. Arrows indicate HMGB1+GFAP+ cells. Scale bar: 20 µm. (B) The expression of HMGB1 and Iba1 in WM following confocal microscopy is indicated by white arrows. White boxes in the merged images are magnified regions. Arrows indicate HMGB1+Iba1+ cells. Scale bar: 20 µm. (C,D) The number of HMGB1+GFAP+ and HMGB1+Iba1+ cells was significantly different in GL-treated and NaCl-treated EAE mice. Data are expressed as the mean ± SEM, n = 4 animals in each experimental group. ###P < 0.001 vs naive group; ***P < 0.001 vs EAE + NaCl group, using one-way ANOVA followed by Bonferroni’s test.

