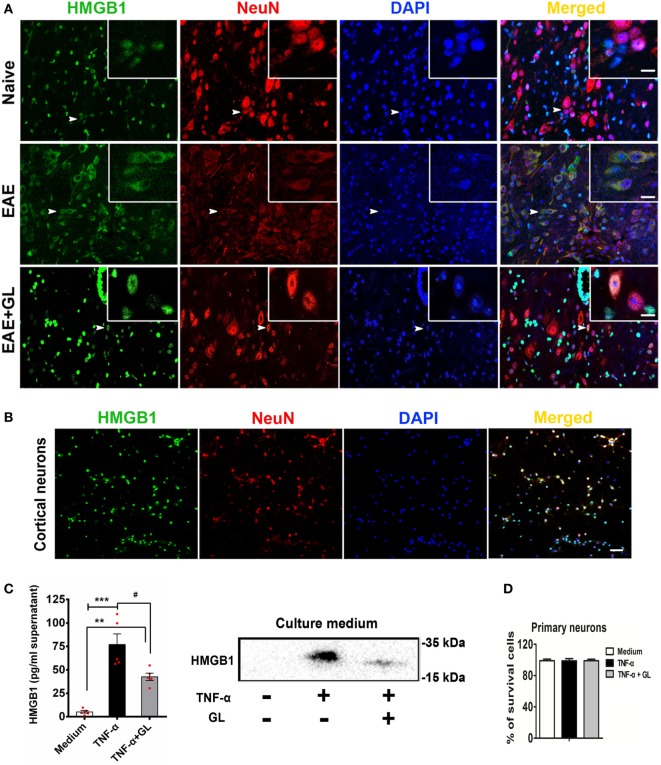
Figure 6.
Translocation and release of high-mobility group box 1 (HMGB1) in neurons. (A) The translocation of HMGB1 in neurons of experimental autoimmune encephalomyelitis (EAE) mice. Representative images of DAPI (blue), HMGB1 (green), and NeuN (red) staining in the central canal of the spinal cord. Co-localization of HMGB1 and NeuN-positive cells is indicated by white arrows. White boxes in the merged images are magnified regions. n = 4 animals in each experimental group, and representative images are shown. Scale bars: 50 µm. (B) The localization of HMGB1 in primary cultured cortical neurons. Immunostaining of neurons with HMGB1 (green), NeuN (red), and DAPI (blue); representative images are shown. Scale bars: 50 µm. (C) ELISA and Western blotting were used to detect HMGB1 in the culture medium of primary cultured cortical neurons. Neurons were stimulated with tumor necrosis factor-alpha (TNF-α) (200 ng/mL) in the absence or presence of GL (3 mmol/L) for 18 h, and culture media were collected and concentrated using ultrafiltration tubes for subsequent ELISA and Western blot analysis. Data are shown as the mean ± SEM, n = 5 of each experimental group. **P < 0.01, ***P < 0.001 vs Medium group; #P < 0.05 vs TNF-α group, using one-way ANOVA followed by Bonferroni’s test. (D) The survival rate of neurons was determined with Trypan blue staining after TNF-α or TNF-α + GL stimulation. The results shown are representative of three independent experiments.

