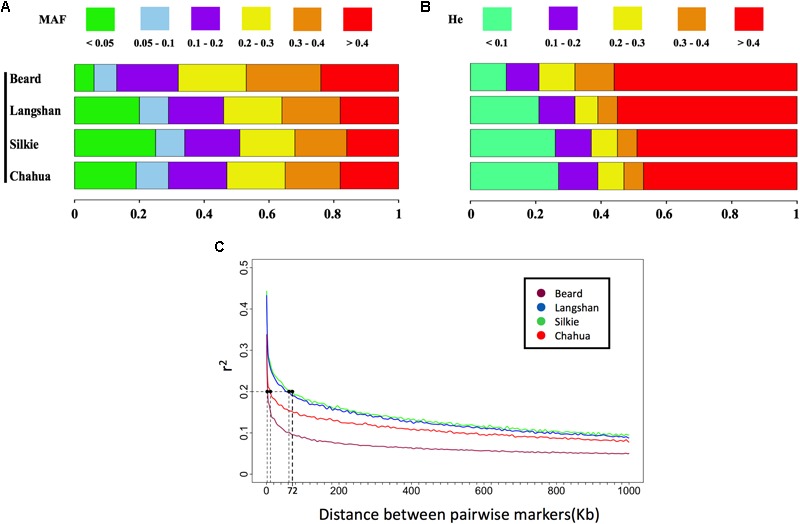
FIGURE 1.

Genetic diversity of four subpopulations estimated by MAF, He, and LD decay. (A) Distributions of minor allele frequency (MAF) estimated from the whole-genome single-nucleotide polymorphism (SNP) set in each subpopulation. Rectangles of different colors indicate different clusters of MAF, while rectangles of different lengths indicate the proportions of markers within different clusters. (B) Distributions of expected heterozygosity (He) estimated from the derived independent SNP set in each subpopulation. Rectangles of different colors indicate different clusters of He, while rectangles of different lengths indicate the proportins of markers within different clusters. (C) Decay of linkage disequilibrium (LD) of the four subpopulations across the genome. The pairwise linkage disequilibrium (r2) is plotted against the corresponding physical distances. When r2 drops to 0.2, the longest interval between two SNPs is the 72 Kb observed in Silkie (shown with dotted lines on graph).
