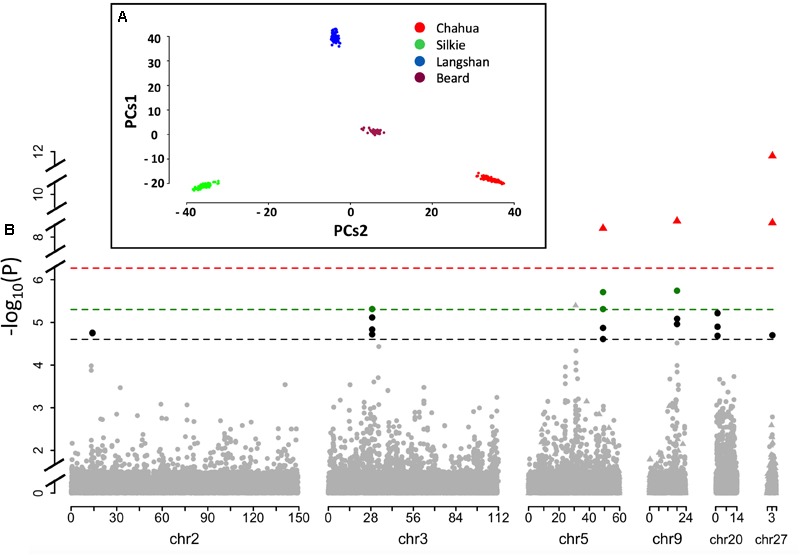
FIGURE 3.

Quantitative trait loci (QTL) profile of the six identified loci across the genome. (A) Mapping samples to the space of the first two Principle Components (PCs1 vs. PCs2) resulting from analysis of genomic kinship. Dots in different colors represent samples from different subpopulations. (B) Schematic of the results from the single-marker association study based on GenABEL and FarmCPU methods. The dashed lines in black, and green denote the 5 and 1% genome-wide significance, respectively, based on package GenABEL. The red line shows the 1% genome-wide significance based on package FarmCPU. Dots represent the results from GenABEL, while triangles represent the results from FarmCPU.
