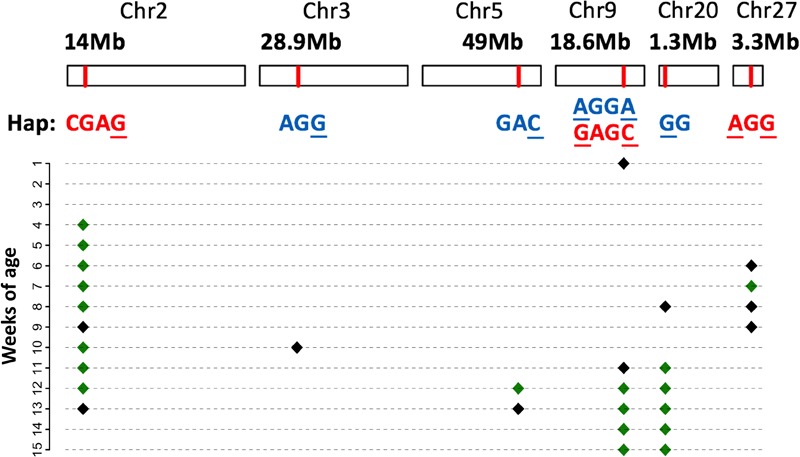
FIGURE 4.

Significant haplotype profile across the genome. The physical position of each QTL is shown at the top; below is the corresponding significant haplotype within each locus. Core SNPs are marked with the underscores. Red letters mean that the corresponding haplotypes increase body weight, while blue letters denote an effect of decreasing the body weight. Their manifested body weight traits at different weeks of age are plotted below, where black and green diamonds denote the 5 and 1% genome-wide significance, respectively.
