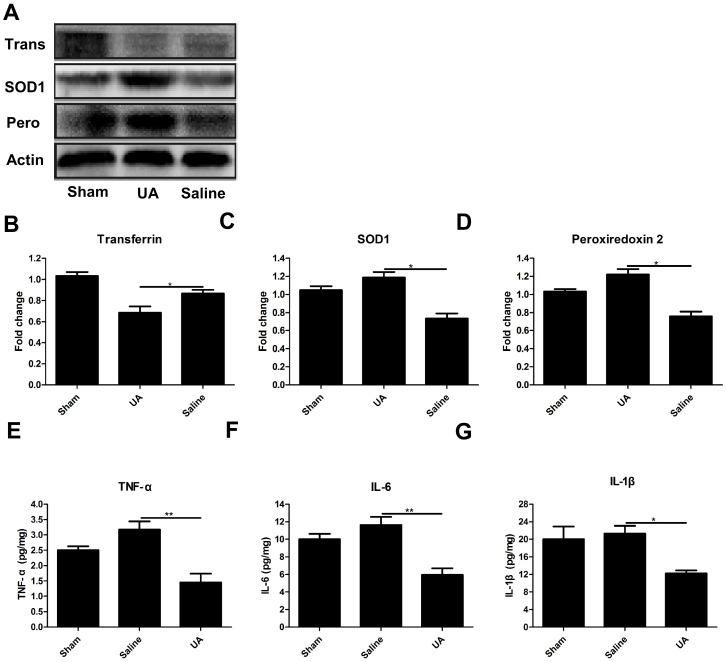
Figure 3.
Effects of UA treatment on oxidative stress and the inflammatory response following CCI. (A-D) Representative bands and quantitative analysis of oxidative markers after CCI. (E-G) Quantitative analysis of inflammatory cytokines after CCI by ELISA. Results are presented as mean±SD (n=5 per group). * indicates P<0.05.

