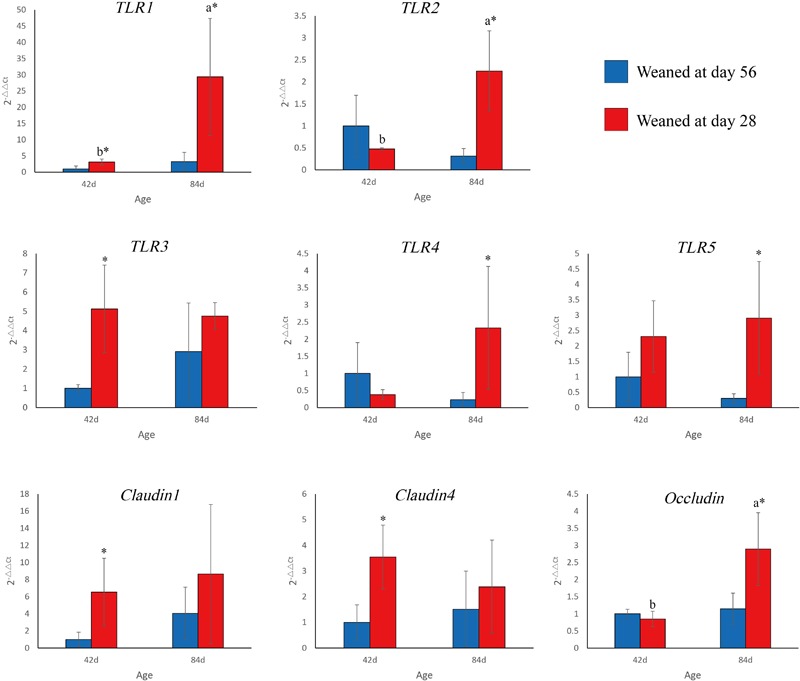
FIGURE 3.

TLR1–5 and tight junction proteins gene expression in the ileum. Error bars show standard deviation. a,bColumns with different letters at different age points across the clusters of bars indicate significant differences (P < 0.05). ∗Columns with asterisks indicate significant differences within a cluster of bars (P < 0.05).
