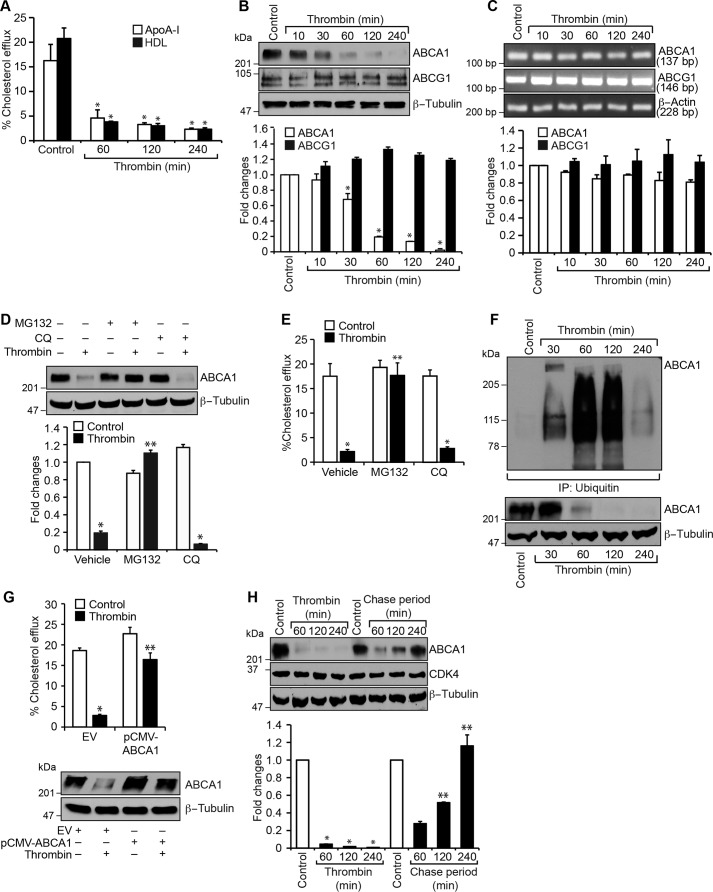
Figure 1.
Thrombin inhibits cholesterol efflux via ABCA1 degradation in mouse primary peritoneal macrophages. A, peritoneal macrophages were labeled with [3H]cholesterol (1 μCi/ml) for 24 h, treated with and without thrombin (0.5 units/ml) for the indicated time periods, and subjected to a cholesterol efflux assay. B, equal amounts of protein from control and the indicated time periods of thrombin-treated macrophages were analyzed by Western blotting for ABCA1 and ABCG1 levels using their specific antibodies, and the ABCA1 blot was normalized to β-tubulin levels. C, equal amounts of RNA from control and the indicated time periods of thrombin-treated macrophages were analyzed by RT-PCR for ABCA1, ABCG1, and β-actin mRNA levels using their specific primers. D, macrophages were treated with and without thrombin in the presence and absence of MG132 (10 μm) or chloroquine (50 μm) for 1 h, cell extracts were prepared and analyzed by Western blotting for ABCA1 levels, and the blot was normalized to β-tubulin levels. E, all of the conditions were the same as in D except that cells were subjected to a cholesterol efflux assay. F, all of the conditions were the same as in B except that the cell extracts were immunoprecipitated with anti-ubiquitin antibodies, and the immunocomplexes were analyzed by Western blotting for ABCA1 levels. The same cell extracts were also analyzed by Western blotting for ABCA1 levels, and the blot was normalized to β-tubulin levels. G, macrophages were transfected with empty vector or pCMV-ABCA1, labeled with [3H]cholesterol (1 μCi/ml) for 24 h, treated with and without thrombin for 2 h, and subjected to cholesterol efflux assay. Cell extracts from a parallel set of experiment were analyzed by Western blotting for ABCA1 to show the overexpression of ABCA1, and the blot was normalized to β-tubulin. H, macrophages were treated with and without thrombin for the indicated time periods or for 1 h, followed by the indicated chase time period. Cell extracts were prepared and analyzed by Western blotting for ABCA1 levels, and the blot was normalized for CDK4 and β-tubulin levels. The bar graphs represent mean ± S.D. (error bars) values of three experiments. *, p < 0.05 versus control or vector; **, p < 0.05 versus thrombin or vector + thrombin.

