Figure 6.
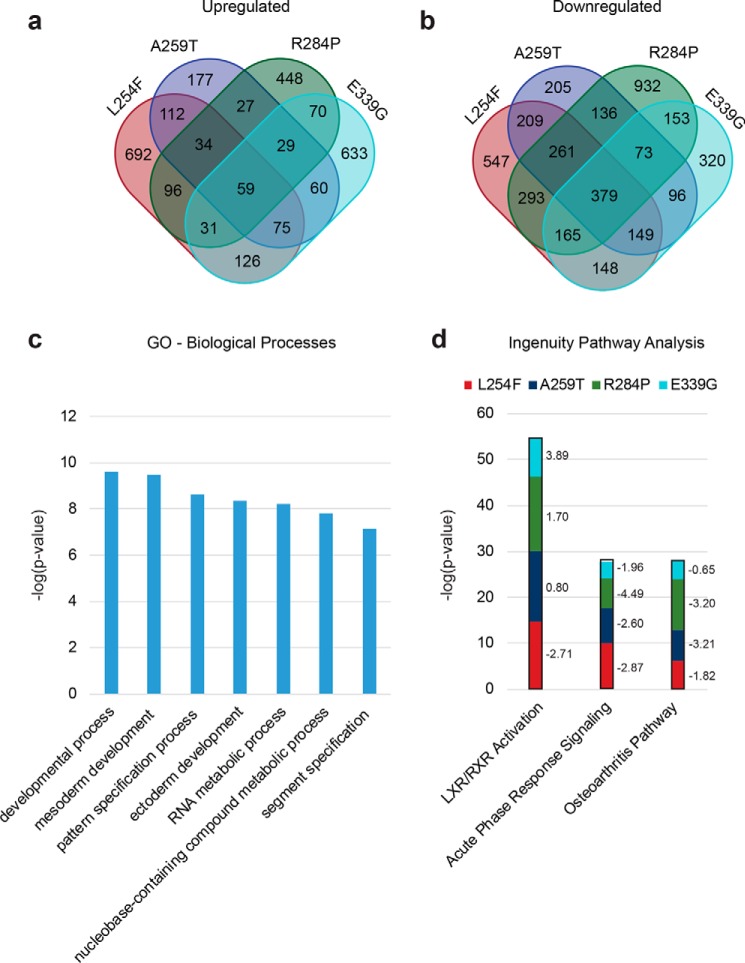
Differential transcriptomes of the hES cells expressing XLID OGT-TPR variants reveal changes in genes associated with neural development. a, number of genes that are >2-fold up-regulated in each of the TPR mutants analyzed compared with WT. b, number of genes that are >2-fold down-regulated in each of the TPR mutants analyzed compared with WT. c, GO analysis (PANTHER Classification System) showing significantly represented (over- or under-represented, p < 1 × 10⁻⁷, Bonferroni correction for multiple testing applied) biological processes in genes that are differentially expressed (up- or down-regulated) in at least three mutants compared with WT. d, pathway analysis (ingenuity pathway analysis, Qiagen) showing significantly represented (over- or under-represented, p < 0.001) pathways in genes found in each of the mutants compared with WT. The z-scores for the pathways in each of the mutants is shown to the right of the bars. A z-score of < −2 denotes the pathway as a whole is down-regulated, and a score of > +2 denotes it is up-regulated. Only those significantly represented pathways with a z-score of ±2 in at least two mutants are shown.

