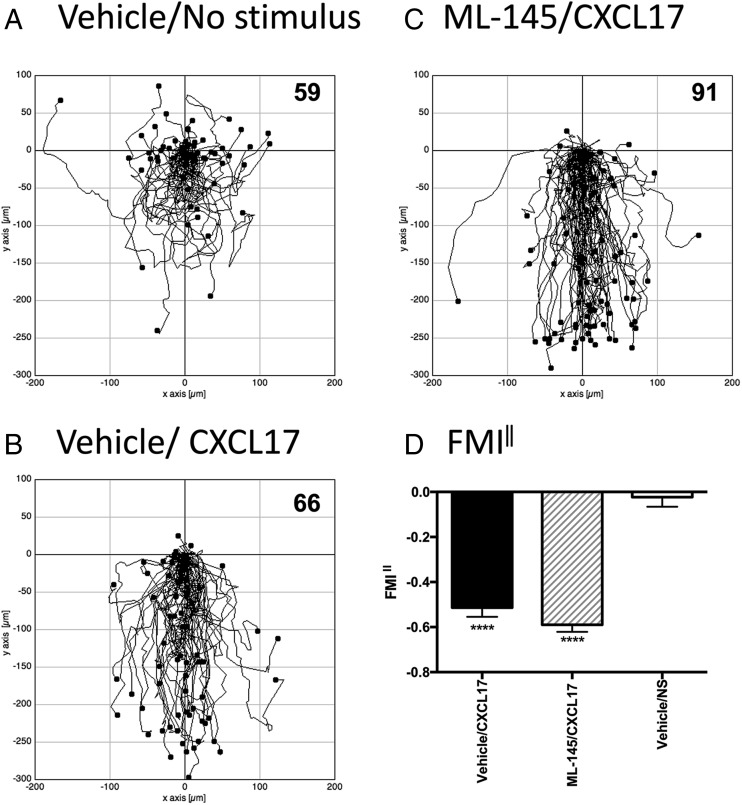
FIGURE 7.
Analysis of the migration of PGE2-treated THP-1 cells along CXCL17 gradients following pretreatment with the GPR35 antagonist ML145. (A)–(C) show the paths traveled by individual cells in response to the stimuli indicated. (A) and (B) show the responses of cells pretreated with the vehicle DMSO, whereas data in (C) show the responses of cells pretreated with the GPR35 antagonist ML145 at a final concentration of 1 μM. Data were pooled from three experiments, with four videos analyzed per condition in each experiment. The total number of cells tracked for each condition are shown in the top right hand corner of the panels. (D) shows the mean FMI‖ ± SEM of the data shown in (A)–(C). Statistical differences between nonstimulus and the indicated stimuli were confirmed by a one-way ANOVA with Bonferroni’s multiple comparisons test. ****p < 0.0001.

