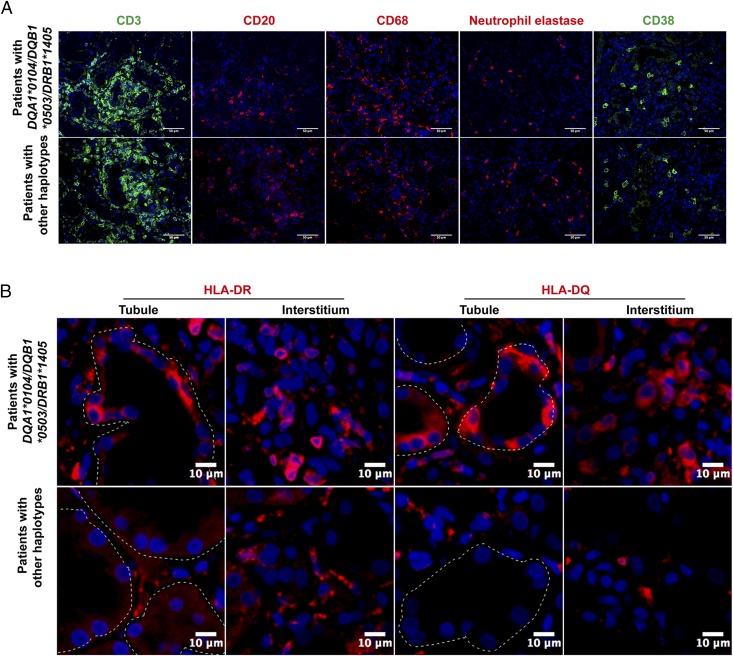
FIGURE 5.
Representative images of immunofluorescence staining. Comparison of inflammatory infiltration (A) and HLA protein expression (B) in patients carrying HLA-DQA1*0104/DQB1*0503/DRB1*1405 (upper panel) or carrying other haplotypes (lower panel). (A) There was no significant difference in the numbers of infiltrating T cells (CD3, green), B cells (CD20, red), plasma cells (CD38, green), and neutrophils (neutrophil elastase, red) between the two groups; macrophage (CD68, red) infiltration was much greater in patients carrying risk haplotype. Scale bar, 50 μm. (B) Enhanced tubular HLA-DR/DQ (red) and interstitial DQ expression were seen in patients carrying HLA-DQA1*0104/DQB1*0503/DRB1*1405. The tubular basements are outlined. Scale bar, 10 μm.

