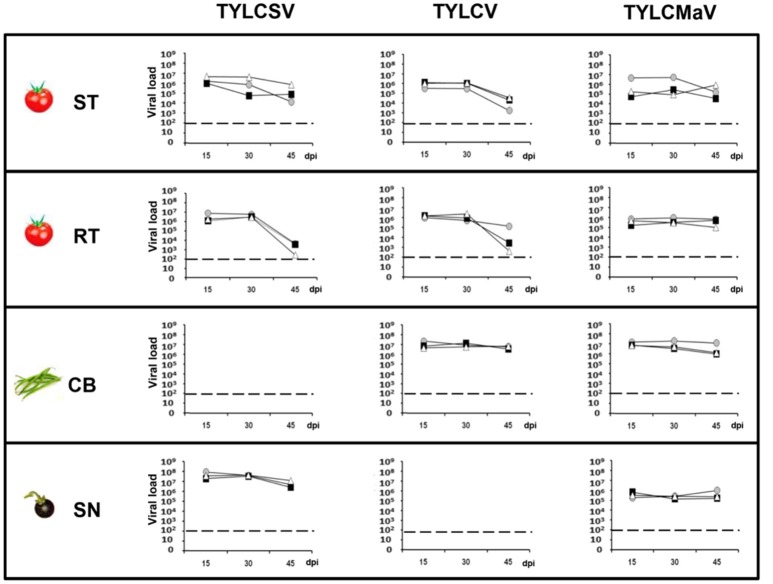
Figure 2.
Absolute quantification of begomovirus ssDNA molecules accumulated during time-course analyses of tomato yellow leaf curl Sardinia virus (TYLCSV), tomato yellow leaf curl virus (TYLCV) and tomato yellow leaf curl Malaga virus (TYLCMaV) infections in susceptible tomato (ST), resistant tomato (RT), common bean (CB) and the wild reservoir Solanum nigrum (SN). Begomovirus DNA molecules present in the apical leaves of plants infected with infectious begomovirus clones were quantified by qPCR. Where possible, begomovirus ssDNA levels were monitored in three individual systemically infected plants (as judged by hybridization analysis) for each virus/host combination. Apical leaf samples were collected at 15, 30, and 45 days post inoculation (dpi). Graphs show viral loads (number of ssDNA genomes per ng of total DNA) in apical leaf samples from individual test plants, indicating average values from three technical qPCR replicates for each DNA extract. Viral DNA values were normalized to the 25S rRNA gene. No viral accumulation was detected at any time point for TYLCSV/common bean or TYLCV/S. nigrum infections either by hybridization or qPCR. Horizontal dotted lines indicate the threshold for qPCR detection. Standard error ranged from 0.01 to 0.001% of the quantified molecules.

