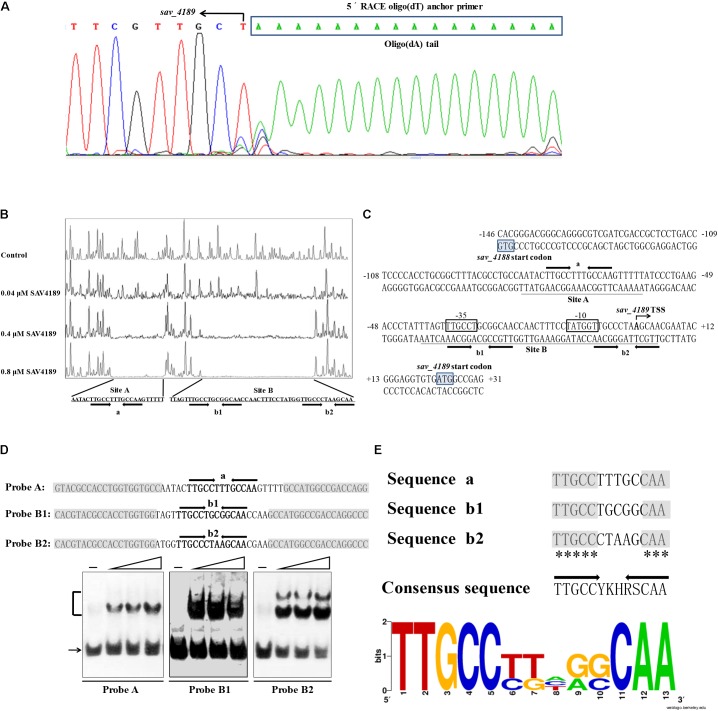
FIGURE 4.
sav_4189 promoter structure and SAV4189-binding sites. (A) Determination of sav_4189 TSS by 5′-RACE PCR. Box: complementary sequence of oligo(dT) anchor primer. Arrow: complementary base of TSS. (B) DNase I footprinting assay of SAV4189 on its own promoter region. Top fluorogram: reaction with 10 μM BSA (control). Protection patterns were acquired with increasing His6-SAV4189 concentrations. (C) Nucleotide sequences of sav_4189 promoter region and SAV4189-binding sites. Numbers: distance (nt) from sav_4189 TSS. Shading: translational start codons. Bent arrow: sav_4189 TSS and transcription orientation. Boxes: potential –10 and –35 regions. Underlining: SAV4189-binding sites. Straight arrows: inverted repeats. (D) EMSAs of His6-SAV4189 with probes A, B1, and B2. Each lane contained 0.3 nM labeled probe. Each probe was 59 bp. Non-specific DNA sequences from hrdB ORF (shaded) were fused with intact 13-bp palindromic sequences a, b1, and b2 (boldfaced) to generate probes A, B1, and B2, respectively. Lanes –: EMSAs without His6-SAV4189. Lanes 2, 3, and 4: 62.5, 125, and 250 nM His6-4189. (E) Consensus sequence analysis of SAV4189-binding sites by WebLogo program. Asterisks: consensus bases. Arrows: inverted repeats. Height of each letter is proportional to appearance frequency of corresponding base.

