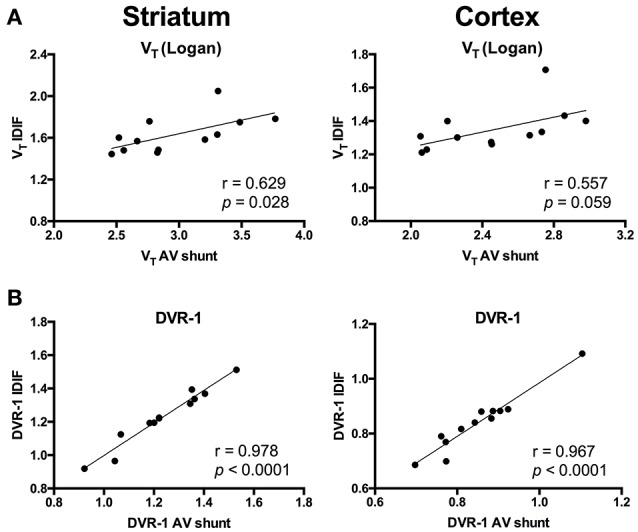
Figure 2.

Correlations between invasive and noninvasive [11C]ABP688 quantification. (A) Volume of distribution (VT) values showed a moderate correlation when comparing the 2 input function approaches in both striatum (left) and cortex (right). (B) Distribution volume ratio (DVR-1) of [11C]ABP688 displayed strong correlations between input function based on arteriovenous shunt and image-derived input function in both striatum (left) and cortex (right). Pearson's correlation test.
