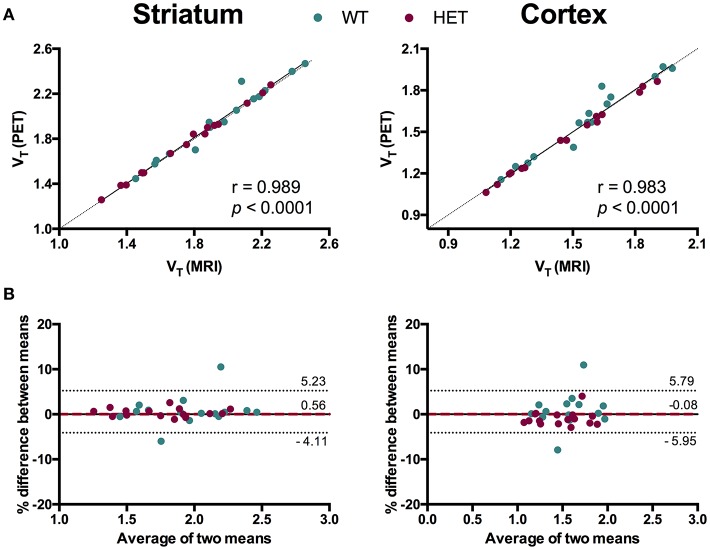
Figure 5.
Comparison of spatial normalization approaches for [11C]ABP688 VT regional quantification. (A) Correlation between VT values in striatum (left) and cortex (right) based on individual MR images- and PET template-based spatial normalizations. Pearson's correlation test. Dashed line represents identity line. (B) Bland-Altman plot to compare the spatial normalization approaches in striatum (left) and cortex (right). The bias between the two approaches corresponds to the difference between the mean (red dashed line) and X axis (solid line). The dotted lines represent the 95% limits of agreement (mean difference ± 1.96 × SD of the differences), respectively. WT, wild type; HET, heterozygous.

