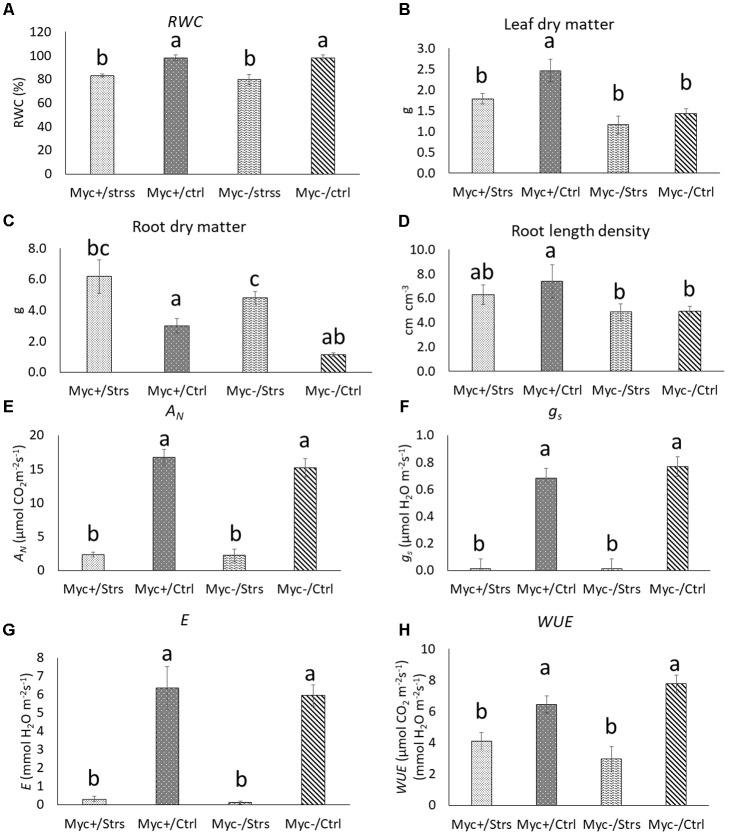
FIGURE 2.
Physiological and growth parameters. (A) Relative water content (RWC) of leaf tissue; (B) leaf dry matter (LDM); (C) RLD; (D) root dry matter (RDM); (E) net photosynthetic rate (AN); (F) stomatal conductance (gs); (G) transpiration rate (E); (H) WUE. Myc+/Stress, AM plants under 96 h of water deficit; Myc+/Ctrl, AM plants under regular irrigation control; Myc–/Stress, no-AM plants under 96 h of water deficit; Myc–/Ctrl, no-AM plants under regular irrigation control. Bars represent standard deviation. Different letters indicate significant differences by Tukey’s test (p < 0.05).

