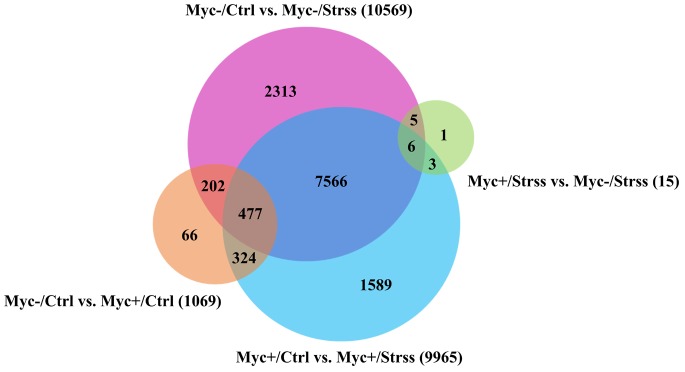
FIGURE 4.
Venn diagram showing relationships among the sets of DEGs retrieved after differential gene expression analysis made between group pairs. Four statistical comparisons include: blue circle: AMF-inoculated roots, control vs. water deficit (Myc+/Ctrl vs. Myc+/Strss); pink-circle: non-inoculated roots, control vs. water deficit (Myc–/Ctrl vs. Myc–/Strss); orange-circle: control roots, non-inoculated vs. AMF-inoculated (Myc–/Ctrl vs. Myc+/Ctrl); green-circle: water deficit treated roots, AMF-inoculated vs. non-inoculated (Myc+/Strss vs. Myc–/Strss). Only DEGs, including transcripts isoforms, with a p-value with FDR < 0.05 were considered.

