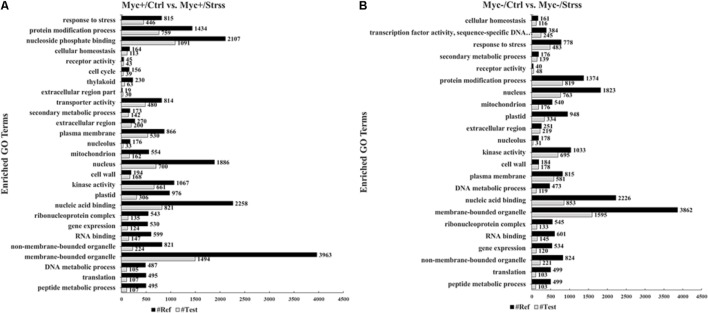
FIGURE 5.
Gene ontology terms over-/underrepresented in both sets of DEGs (A, Myc+/Ctrl vs. Myc+/Strss and B, Myc-/Ctrl vs. Myc-/Strss) after enrichment analysis performed based on a Fisher-2 tailed test at FDR < 0.01. Numbers of DEGs assigned to each GO term are plotted at the right of the bars. Open bars: Test set expressed by the differentially regulated genes; closed bars: Reference set given by total set of Phaseolus vulgaris transcripts.

