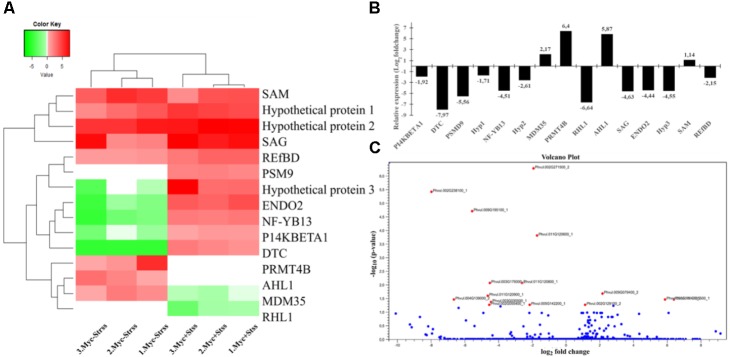
FIGURE 6.
RNA-Seq differential gene expression analysis comparinganalysis comparing water deficit treatments non-inoculated against AMF-inoculated common bean roots (Myc–/Strss vs. Myc–/Strss). (A) Heat maps of all differentially expressed transcripts within biological replicates (p-value with FDR < 0.05). Heat maps based on individual Log2 transformed normalized expression data. (B) Log2 transformed relative expression data comparing the means of normalized counts retrieved for each DEG in both conditions. (C) Volcano plot; transcripts found to significantly up-/down-regulated (p-value with FDR < 0.05) are red colored dots.

