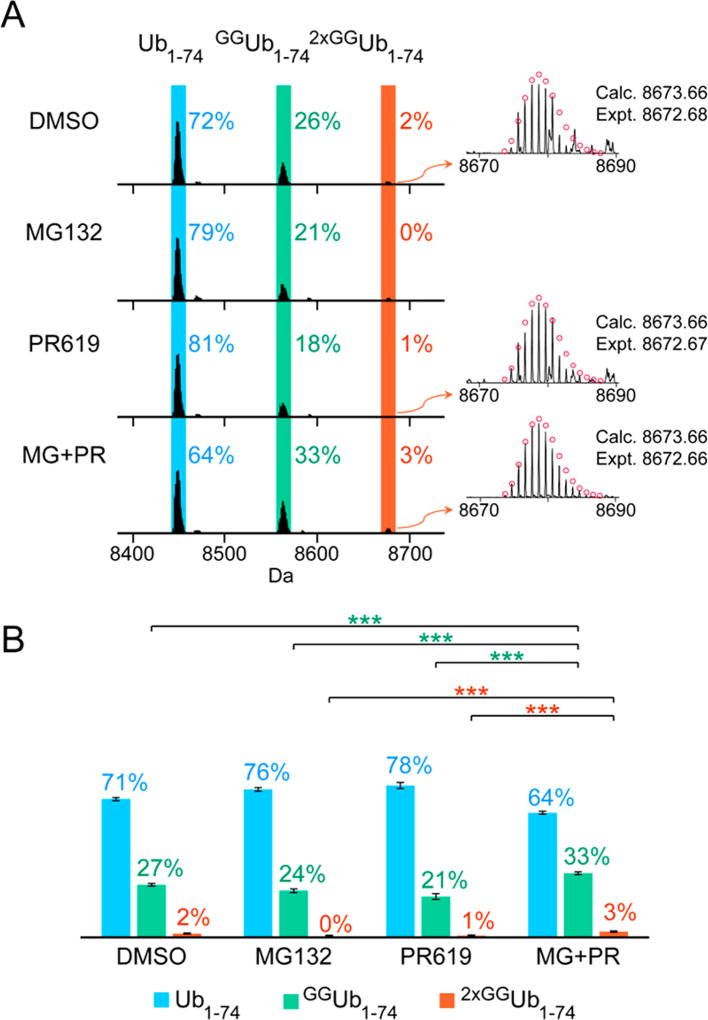
Figure 2.
UbiChEM-MS analysis of Ub chains enriched from asynchronous cells. (A) Representative deconvoluted MS spectra for all the conditions tested highlighting the three minimal digestion products: Ub1–74 (blue), GGUb1–74 (green) and 2×GGUb1–74 (orange). (B) The distribution was calculated by averaging relative abundance of each Ub1–74 species to total abundance of all three Ub1–74 species from three biological replicates for each condition (Table S1). Error bars represent standard error of the mean (SEM) for each data set; * p < 0.05, ** p < 0.01, and *** p < 0.001 (Student’s t test). The reported calculated (calc.) and experimental (expt.) values correspond to the monoisotopic molecular weight.

