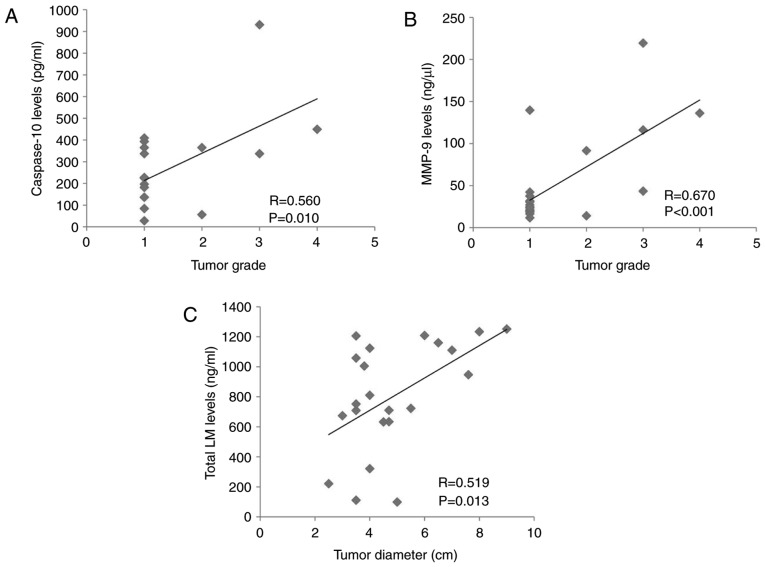
Figure 3.
Analyses of the correlation between clear cell renal cell carcinoma clinical data and the levels of caspase-10, MMP-9 and total LM. (A) Correlation between caspase-10 levels in tumor tissues and tumor grade. (B) Correlation between MMP-9 levels in tumor tissues and tumor grade. (C) Correlation between total LM levels in tumor tissues and tumor diameters. MMP, matrix metalloproteinase; LM, laminin.

