Figure 4.

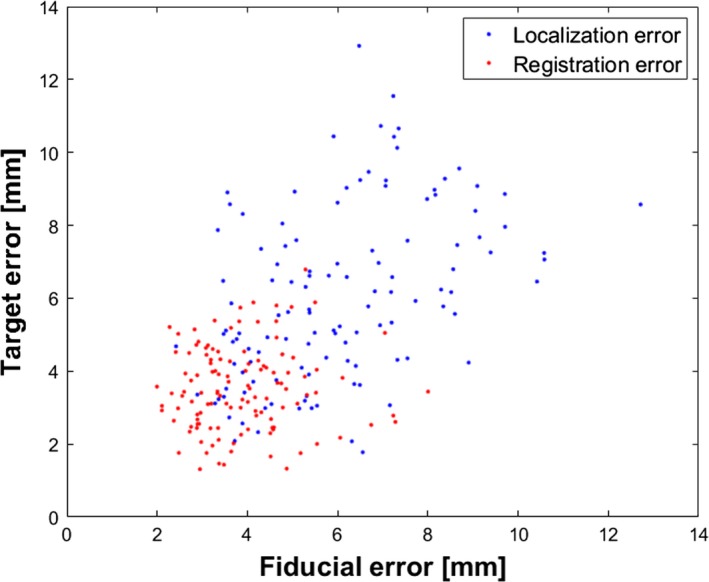
Median values of FLE_BH vs TLE_BH (blue dots) and FRE_BH vs TRE_BH (red plots) estimated for all patients and treatment fractions.

Median values of FLE_BH vs TLE_BH (blue dots) and FRE_BH vs TRE_BH (red plots) estimated for all patients and treatment fractions.