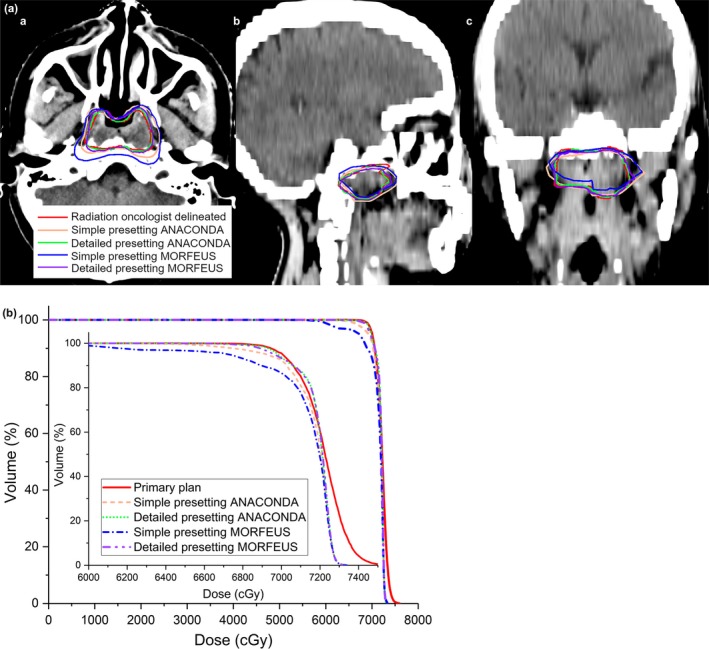
Figure 2.

Geomtric and dosimetric variations using different DIR processings for one typical patient. (A). Geometric variations between the RO delineated and the DIR propagated GTV contours on the weekly CT of one typical patient (a) in axial view (b) in sagittal view (c) in coronal view; (B). Comparison of the DVH line for the GTV between the primary planning dose and the DIR‐accumulated weekly doses.
