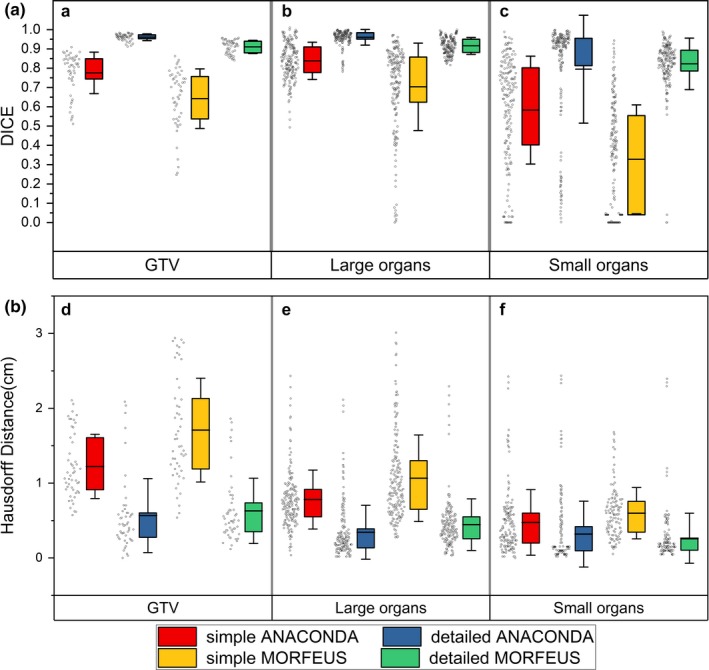
Figure 3.

DICE and Hausdorff distance variations of all the patients. (A) Box and whisker plot showing the DIR‐caused DICE coefficient variations for (a) the GTV (b) the large organs (c) the small organs. The limits of each box represent the 25th and 75th percentiles, the whisker represents the standard deviation, and the middle black line represents the average value. The dots next to each box show the trend of the corresponding statistics of all the ten patients; (B) Box and whisker plot showing the DIR‐caused Hausdorff distance variations for (d) the GTV (e) the large organs (f) the small organs. The limits of each box represent the 25th and 75th percentiles, the whisker represents the standard deviation, and the middle black line represents the average value. The dots next to each box show the trend of the corresponding statistics of all the ten patients.
