. 2018 Apr 26;19(4):48–57. doi: 10.1002/acm2.12338
© 2018 The Authors. Journal of Applied Clinical Medical Physics published by Wiley Periodicals, Inc. on behalf of American Association of Physicists in Medicine.
This is an open access article under the terms of the http://creativecommons.org/licenses/by/4.0/ License, which permits use, distribution and reproduction in any medium, provided the original work is properly cited.
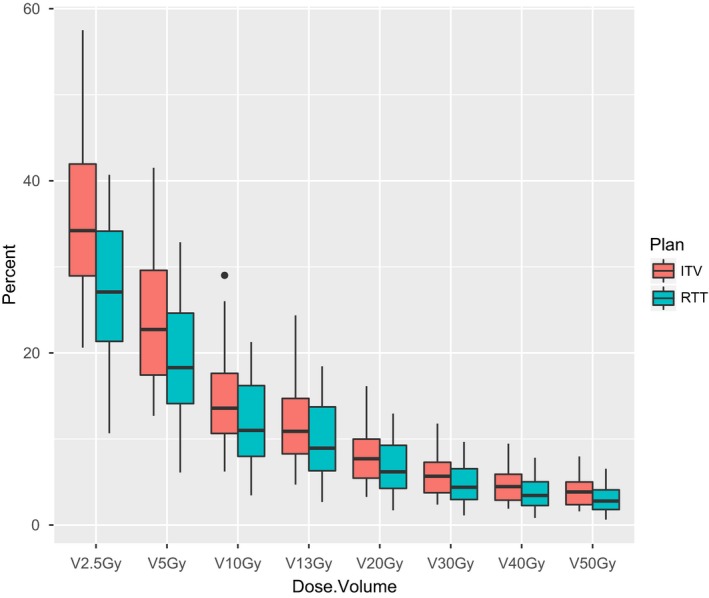
Figure 2.

Boxplots of lung dose–volume percentages by plan type.
