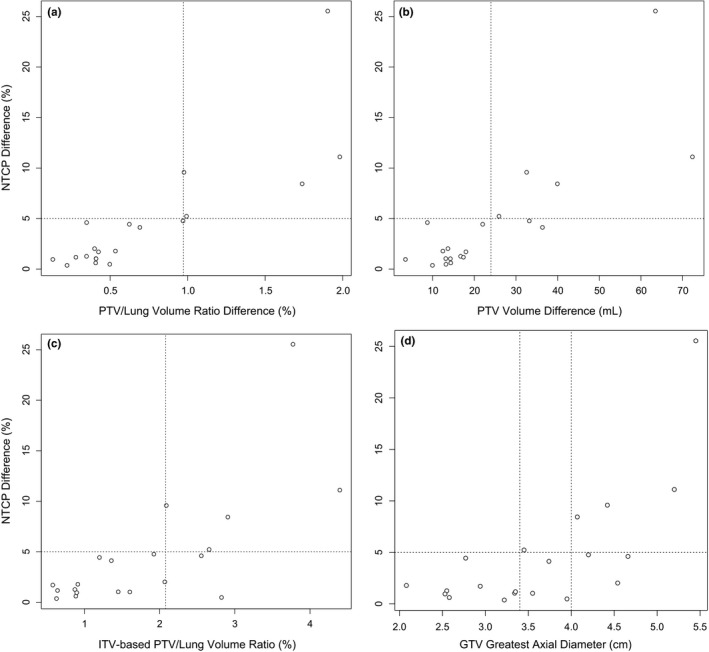
Figure 4.

Scatterplots of increase in NTCP by increase in PTV/lung volume ratio (a), increase in PTV volume (b), PTVITV/lung volume ratio (c), and GTV greatest axial diameter (d). Plots are marked at 5% increase in NTCP and at proposed classification thresholds (a: 0.973%; b: 24.0 mL; c: 2.08%; d: 3.4 cm or 4.0 cm).
