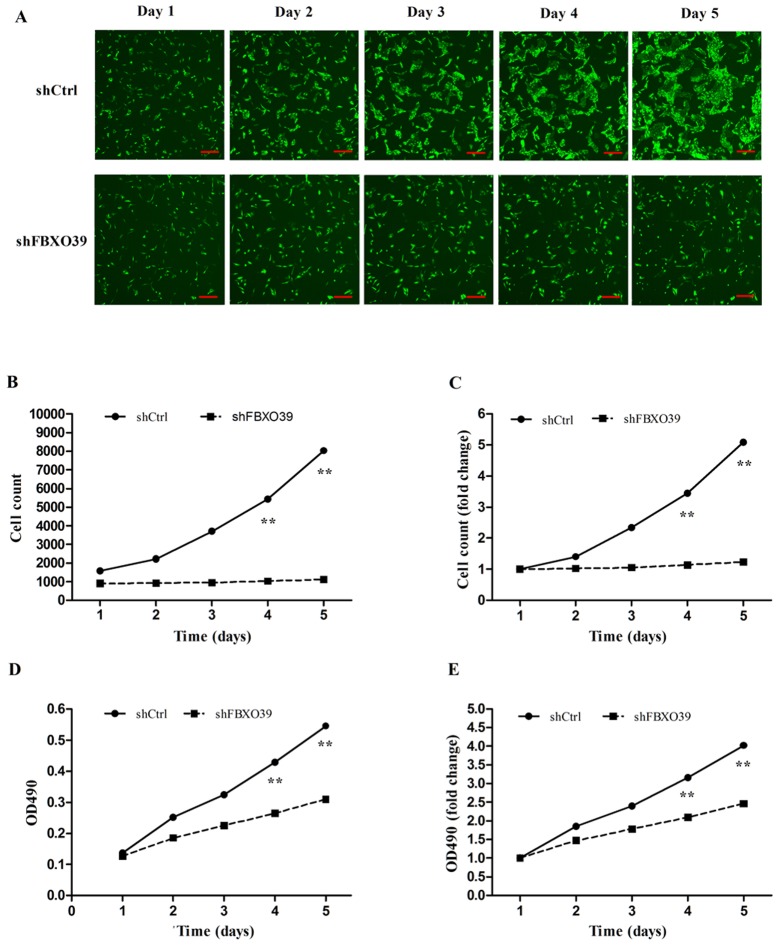
Figure 3.
FBXO39 knockdown inhibits the proliferation of U-2OS. (A) Celigo analysis of shCtrl and shFBXO39 cells was performed 3 days after transfection. The increasing of fluorescence (cell numbers) in shFBXO39 cells was significantly inhibited. All images were captured at the original magnification. Scale bars, 300 µm. (B) Graph presenting the cell numbers over 5 days. (C) Graph presenting the cell growth rate, obtained by comparing the cell count of each day to that of day 1. (D) The OD490 was detected by MTT assay each day for 5 days after transfection. OD490 indicated the amount of viable cells. The proliferation of shFBXO39 cells was significantly inhibited. (E) The fold change of OD490 (the cell growth rate) was obtained by comparing the OD490 of each day to that of day 1. The cell growth rate of shFBXO39 was notably lower. **P<0.01, vs. shCtrl. FBXO39, F-box protein 39; shFBXO39, cells transfected with FBXO39-targeting shRNA; shCtrl, cells transfected with control shRNA; OD490, optical density at 490 nm.

