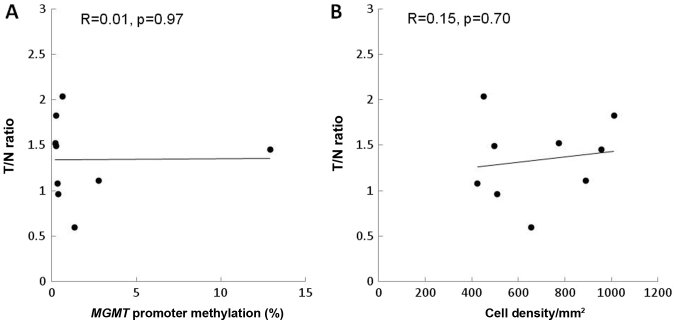
Figure 3.
Correlation of the T/N ratio of 11C-methionine positron emission tomography with MGMT methylation and cell density in a histological comparison using stereotactic images of recurrent gliomas. The T/N ratio revealed no correlation with (A) MGMT methylation (R=0.01, P=0.97) or (B) cell density (R=0.15, P=0.7).

