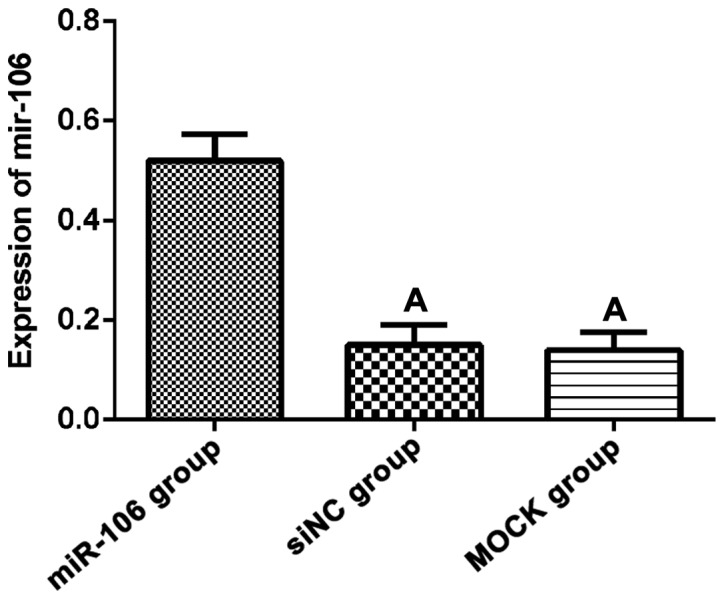
Figure 1.

Expression of miR-106 in each group of cells. RT-qPCR results showed that the expression level of miR-106 in miR-106 group was significantly higher than that in siNC and MOCK group (p<0.05), but there was no significant differences between siNC and MOCK group (p>0.05). ΑP<0.05, compared with miR-106 group. RT-qPCR, reverse transcription-quantitative PCR.
