Figure 2.
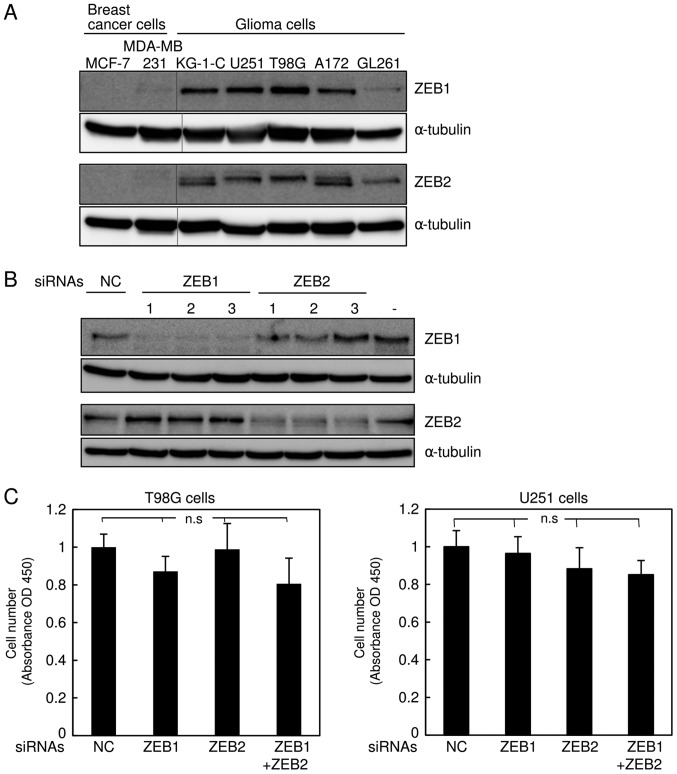
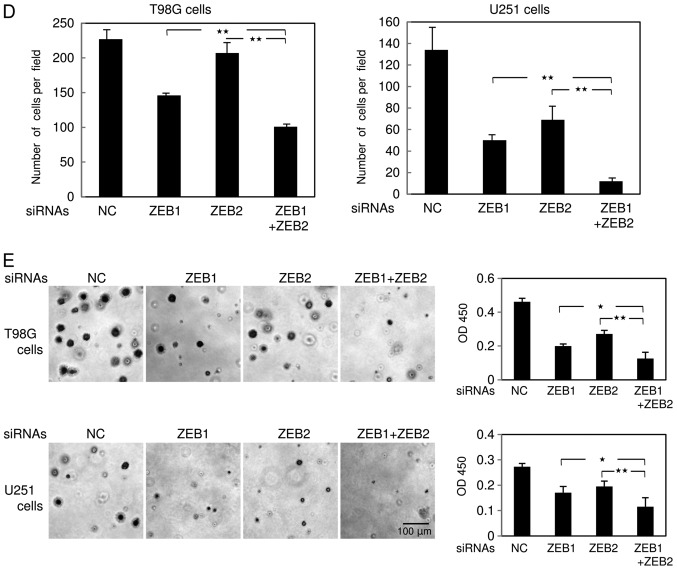
Knockdown of ZEB1 and ZEB2 in human glioma cells. (A) Expression levels of ZEB1 and ZEB2 were examined by immunoblot analysis in MCF7 cells (the luminal subtypes), MDA-MB-231 cells (the basal-like subtypes), and several types of glioma cells. (B) After transfection of human glioma T98G cells with control siRNA (NC) or three different kinds of siRNAs targeting human ZEB1 (1–3) or ZEB2 (1–3), expression of ZEBs was examined by immunoblot analysis. (−) indicates no transfection. (C-E) After transfection of T98G and U251 cells with control siRNA (NC) or siRNAs against both ZEB1 (1) and ZEB2 (3) or either alone, the cells were subjected to the MTT assay, and (C) the results were analyzed by one-way factorial ANOVA followed by Fisher's PLSD test (n.s, not significant). (D) The results of Boyden chamber assay were analyzed by one-way factorial ANOVA followed by Fisher's PLSD test (**P<0.01). (E) After photographs were acquired (magnification, ×200), the results of the colony formation assay were analyzed by one-way factorial ANOVA followed by Fisher's PLSD test (*P<0.05, **P<0.01). Each value represents the mean ± standard deviation of triplicate determinations from a representative experiment. (C-E) Similar results were obtained in at least two independent experiments.


