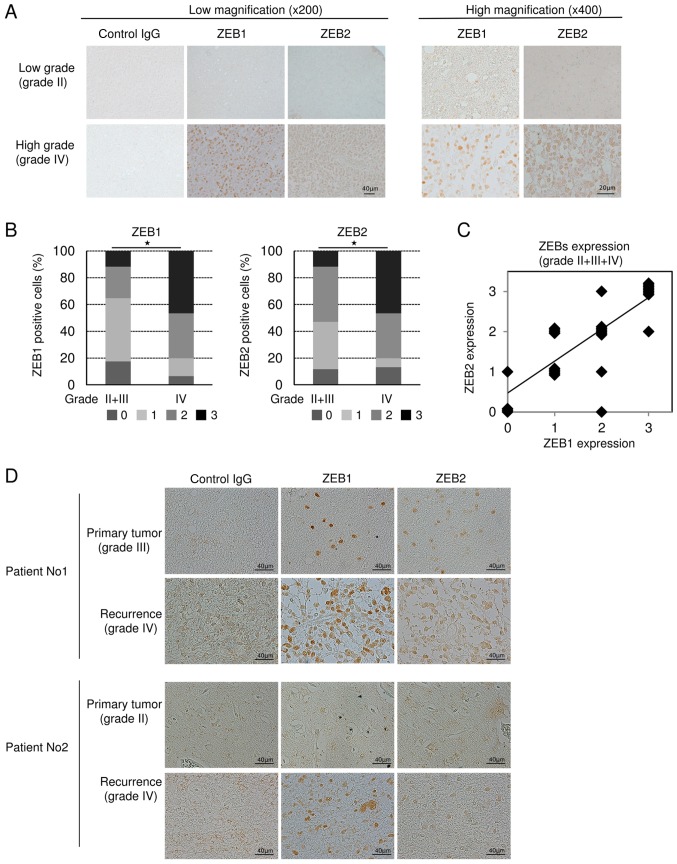
Figure 3.
Immunohistochemical analysis of ZEB1 and ZEB2 in human glioma specimens. (A) Representative images of immunohistochemical staining with control IgG, anti-ZEB1 antibody, and anti-ZEB2 antibody are shown: Grade II (n=11), grade III (n=4), and grade IV (n=15). (B) Intensity of ZEB1- and ZEB2-positive cells was scored: 0 for negative (fewer than 1% positive cells in a field); 1 for weak (1–24%); 2 for intermediate (25–49%); and 3 for strongly positive (>50%). Data were subjected to statistical analyses using non-parametric Mann-Whitney U tests (*P<0.05). (C) Correlation analysis of ZEB1 and ZEB2 expression was performed in grade II, III, and IV by Spearman's rank correlation coefficient tests [r=0.809 (P<0.01)]. (D) Initial resected tumor and recurrent tumor with malignant transformation in two patients.

