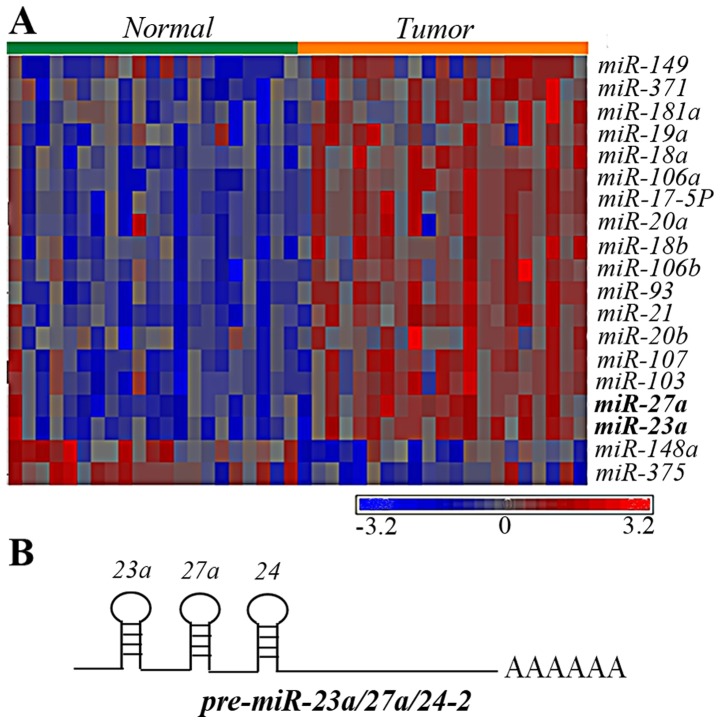
Figure 1.
miR expression pattern in gastric cancer. (A) Heat map showing expression levels of the indicated miRNA in relation to tissue type. The color represents the expression level of the microRNA, according to the color key shown below the heat map. Red represents high expression; blue represents low expression. (B) The structure of the pre-miRNA-transcript of miR-23a/27a/24-2. mi, micro; miR, microRNA.

