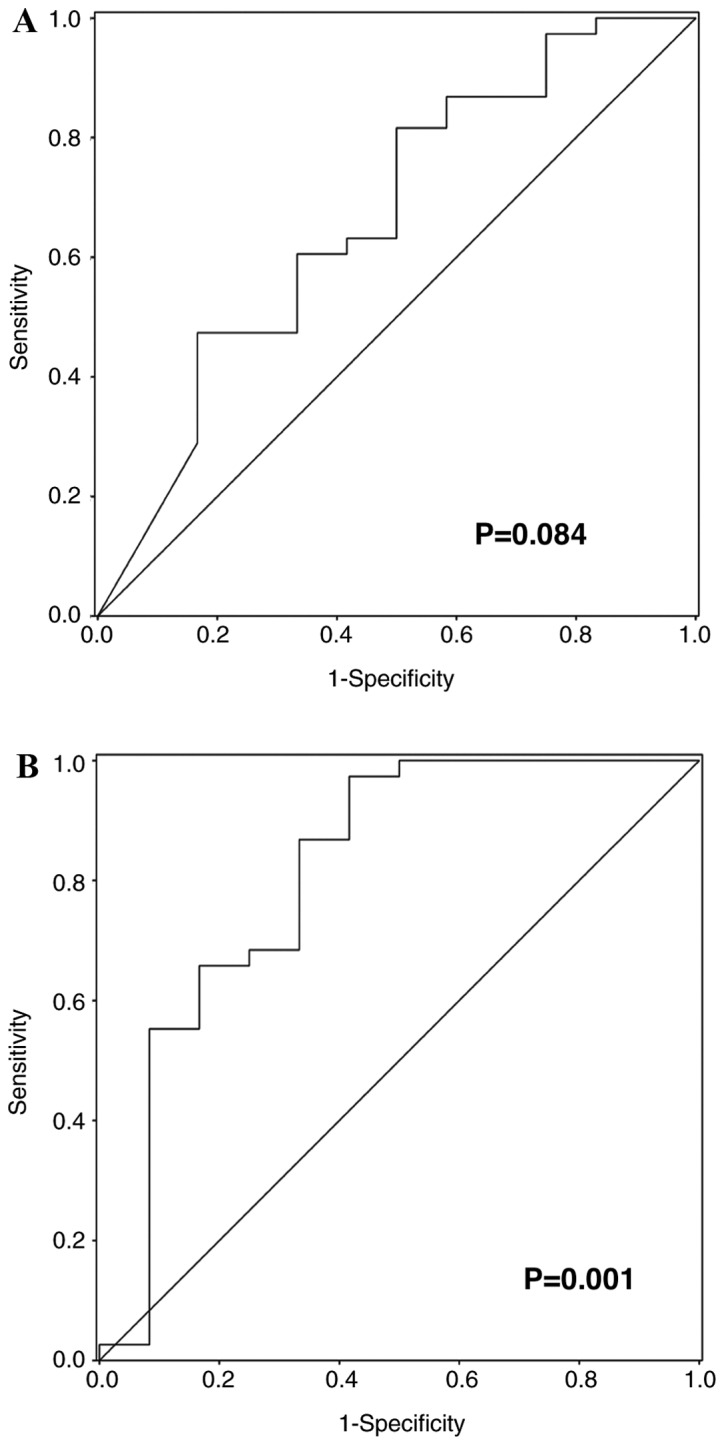
Figure 2.

ROC curve analysis. (A) Change in tumor metabolic activity following 3 courses of chemotherapy for the prediction of CR following 6 courses of chemotherapy (AUC, 0.677; P=0.084). (B) The use of a multivariate model for the prediction of CR following 6 courses of chemotherapy (AUC, 0.814; P=0.001). ROC, receiver operating characteristic; CR, complete response; AUC, area under the ROC curve.
