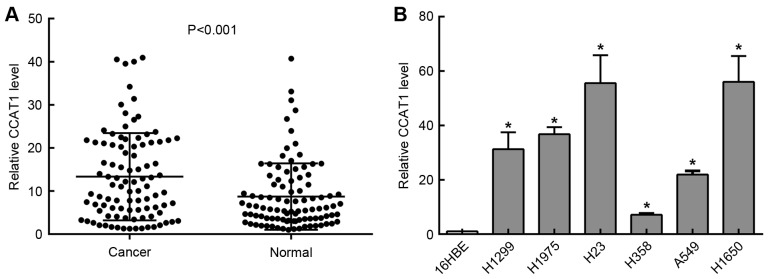
Figure 1.
CCAT1 expression in lung adenocarcinoma tissues and cell lines. (A) Expression levels of CCAT1 in human lung adenocarcinoma tissues and corresponding adjacent tissues determined by RT-qPCR (n=96, analyzed by Student's t-test). The mean expression level of CCAT1 in lung adenocarcinoma tissues was significantly higher than that in corresponding non-malignant lung tissues. β-actin was used as an internal control. (B) Expression level of CCAT1 in lung adenocarcinoma cell lines determined by RT-qPCR. The mean expression level of CCAT1 in lung adenocarcinoma cells was significantly higher than that in the human bronchial epithelial cell line 16HBE. β-actin was used as an internal control. *P<0.01 vs. 16HBE (analyzed by one-way ANOVA). CCAT1, colon cancer-associated transcript 1; RT-qPCR, reverse transcription-quantitative polymerase chain reaction.

