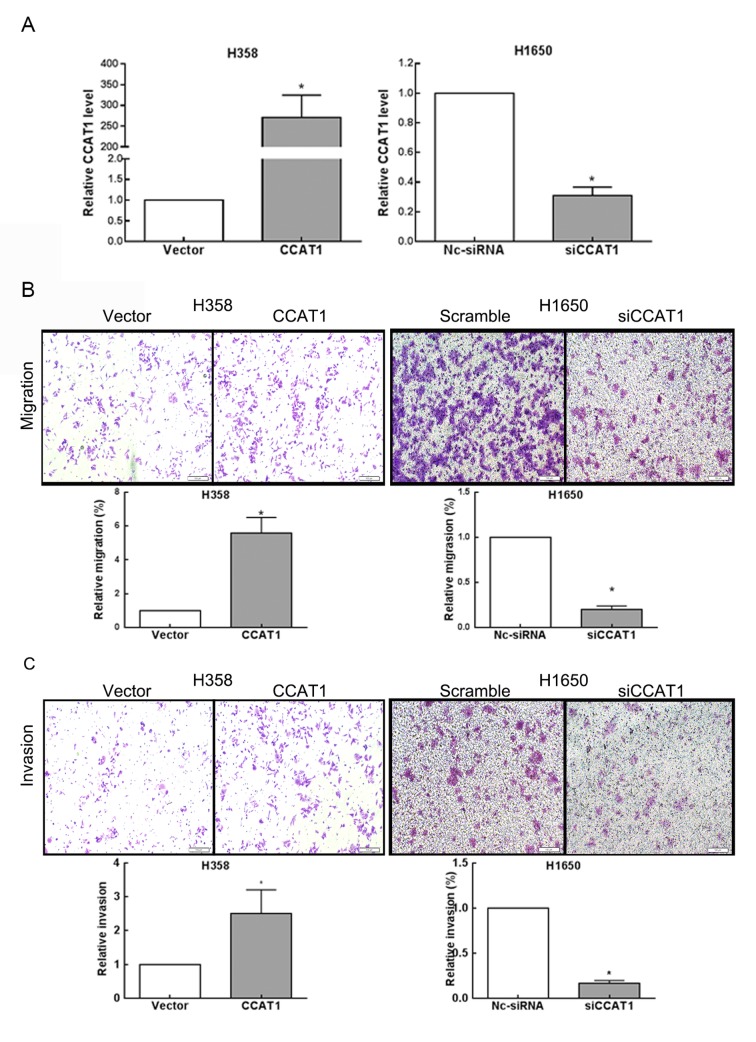
Figure 2.
CCAT1 regulates cell migration and invasion in vitro. (A) CCAT1 expression levels were determined using reverse transcription-quantitative polymerase chain reaction in H358 and H1650 cells transfected with pcDNA3.1-CCAT1 or an empty vector. β-actin was used as an internal control. Corresponding P-values analyzed by Mann-Whitney U-test are indicated. (B) Representative images and quantification of Transwell migration assays for H358 and H1650 cells indicated that CCAT1 promotes cells migration in vitro (scale bar, 50 µm). *P<0.01. Corresponding P-values analyzed by Mann-Whitney U-test are indicated. (C) Representative images (up) and quantification (down) of Transwell invasion assays for H358 and H1650 cells demonstrated that CCAT1 promotes cells invasion in vitro (scale bar, 50 µm). *P<0.01. Corresponding P-values analyzed by Mann-Whitney U-test are indicated. CCAT1, colon cancer-associated transcript 1; siCCAT1, small interfering RNA against colon cancer-associated transcript 1; Nc-siRNA, noncoding small interfering RNA.

