Figure 4.
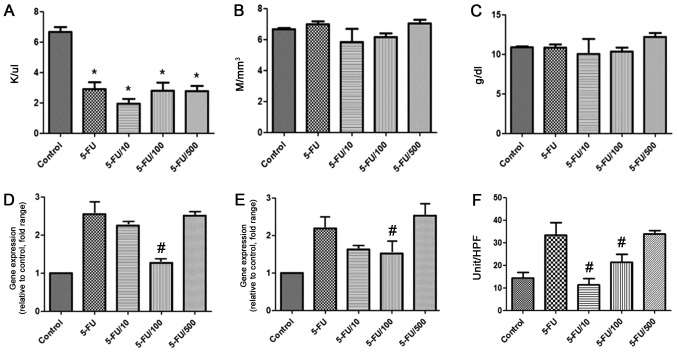
Effect of ursodeoxycholic acid on hematology, levels of inflammatory cytokines, and MPO levels in different groups. (A) White blood cell count, (B) red blood cell count and (C) hemoglobin level. Data are presented as the mean ± standard deviation. Secreted (D) interleukin-6 and (E) tumor necrosis factor-α mRNA levels. Data are represented as fold-changes relative to the control. (F) MPO activity. Data are shown as the mean ± standard deviation. *P<0.05 vs. the control; #P<0.05 vs. the 5-FU group. 5-FU, 5-fluorouracil.

